saro_k_82
Full Member level 6
Re: Opamp with big LOAD
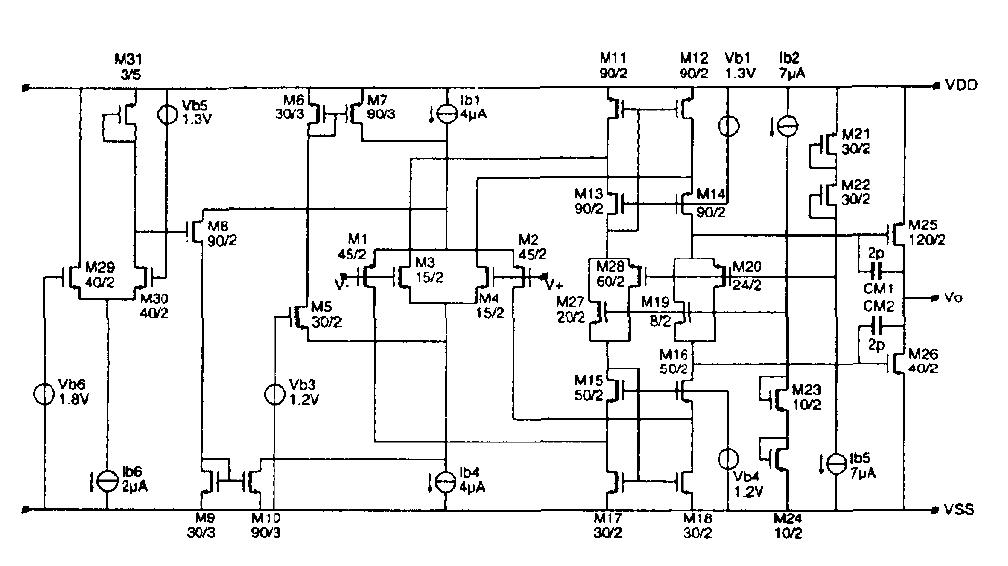
Please refer to the attached figure. The beta in this case is sCM/GM1 has to be around both the stages. The amplifier can be modeled this way without any error. You have made corrections to A1(s) and tried to isolate by computing Z12., and get a picture with two separate blocks in cascade., which allows you to write Atot(s)=A1m(s)*A2m(s) (A1m and A2m are modified transfer functions) (which is not so useful from control theory as CM impacts both the transfer functions) which can have very different poles and zeros than A1(s) and A2(s). I only doubt the way the isolation is done.
So A1m and A2m dont necessarily yield their own stage poles.
I did read your pdf file 10 days back I guess., I'll now take a serious look and find out the flaws if any.
Just a quick question.,
Just to point out again., the A1(s) (and Z12(s)) plot is heavily influenced by what happens in the second stage., the graph of A1(s) is what both of us acknowledge., what matters is what drives the pole of A1(s)., which is not easy to obtain from ac plots. My claim is that the first pole in A1(s) plot is the output pole and yours is that it is the first stage pole. I hope we agree on everything else.
I mentioned that the Atot(s) plot in your previous post does not match the values in the pole table., I was able to see higher CM separating the poles further in the graph.
Thanks,
Saro
sutapanaki said:I hope you'll agree with me that if I measure the total gain as V2(s)/Vin(s) this should be the real gain of the amplifier, right? Let's call this simply GAIN. There are two stages in this amplifier. As is shown in my original file I attached in the beginning, I call the voltage at the output of the 1st stage V1(s). I define A1(s)=V1(s)/Vin(s). Then, I define A2(s)=V2(s)/V1(s). V2(s), of course, is the voltage at the output of the 2nd stage, which is also the output voltage of the whole amplifier. Then finally I define GAIN_TOT=A1(s)*A2(s). According to what you say, GAIN is not equal to GAIN_TOT - did I understand right? Because if I do it this way the two stages appear decoupled. I don't agree with this and it is because when I look from the output of the 1st stage into the the second stage I see Z12(s) which includes also CM. A quick simulation, yet another attachment shows GAIN and GAIN_TOT for CM=0, 1p, 10p, 100p, 1n. As you see, those two gains are completely identical, overlapping perfectly. So, they are the same.
Please refer to the attached figure. The beta in this case is sCM/GM1 has to be around both the stages. The amplifier can be modeled this way without any error. You have made corrections to A1(s) and tried to isolate by computing Z12., and get a picture with two separate blocks in cascade., which allows you to write Atot(s)=A1m(s)*A2m(s) (A1m and A2m are modified transfer functions) (which is not so useful from control theory as CM impacts both the transfer functions) which can have very different poles and zeros than A1(s) and A2(s). I only doubt the way the isolation is done.
So A1m and A2m dont necessarily yield their own stage poles.
I did read your pdf file 10 days back I guess., I'll now take a serious look and find out the flaws if any.
Just a quick question.,
I agree that all this happens when you try to isolate in to two separate blocks., but do you really see three poles for some values?., there are only three caps of which only two can have independent voltages.., so there can only be two poles in any case., so this is an obvious error.sutapanaki said:If you look at the plot of A1(s) there are two poles and a zero. The first pole I call P1, the second pole I call P2. P1 is also the dominant pole of the whole amplifier and P2 happens to be it's non-dominant pole - of course after a certain value of CM, which is in the table. P2s is just the pole of the second stage.
Just to point out again., the A1(s) (and Z12(s)) plot is heavily influenced by what happens in the second stage., the graph of A1(s) is what both of us acknowledge., what matters is what drives the pole of A1(s)., which is not easy to obtain from ac plots. My claim is that the first pole in A1(s) plot is the output pole and yours is that it is the first stage pole. I hope we agree on everything else.
I mentioned that the Atot(s) plot in your previous post does not match the values in the pole table., I was able to see higher CM separating the poles further in the graph.
Thanks,
Saro
") . Your pz report is very similar to mine., but you still say that first stage pole becomes dominant. The poles which were initially at 800Hz and 40KHz moved to 1Hz and 315KHz in their own paths apart from each other. I dont see them getting closer for CM=1pF and then moving apart. You are quoting the last two columns in your table as the poles of the total TF from the simulation right?
. Your pz report is very similar to mine., but you still say that first stage pole becomes dominant. The poles which were initially at 800Hz and 40KHz moved to 1Hz and 315KHz in their own paths apart from each other. I dont see them getting closer for CM=1pF and then moving apart. You are quoting the last two columns in your table as the poles of the total TF from the simulation right?