narayani
Full Member level 2
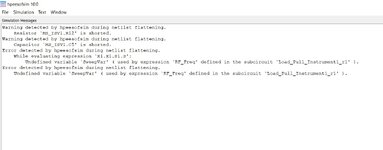
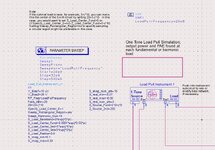
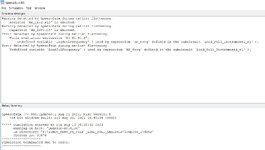
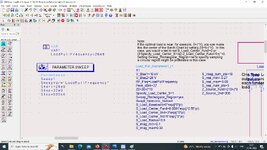
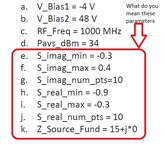
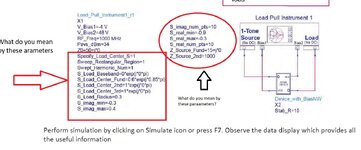
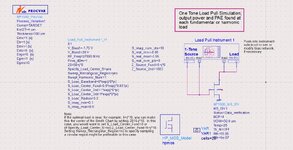
I want to do Load Pull Analysis of MMIC Power Amplifier. I have listened Anuragh Bhargav's RF Design-13: Getting Started with Load Pull Simulations (Link for the same is attached below). After listining the same I started designing PA using Keysight Technologies ADS 2022 by following the steps from the same RF Design Tutorial -13 and I followed exactly. When I simulated Load Pull Analysis, I am getting blank graphs. Someone can guide me how to plot load pull analysis. Below I have attached the screen shots which I have taken from RF Design-13 and obtained results.
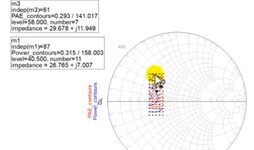
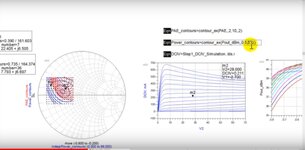
Desired Outputs graphs are as follows:
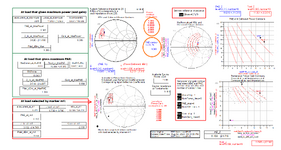
1. Desired_Ouput_Graphs
2. Desired_Ouput_Graphs_1
3. Desired_Ouput_Graphs_2
4. Desired_Ouput_Graphs_3
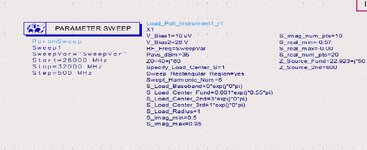
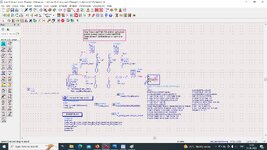
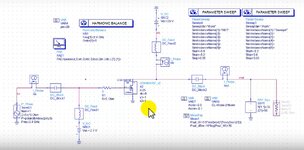
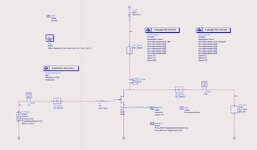
5. Schematic_1
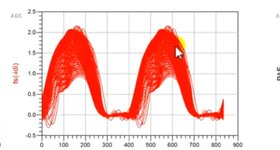
Obtained Outputs are as follows:
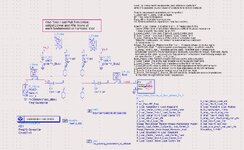
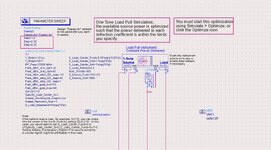
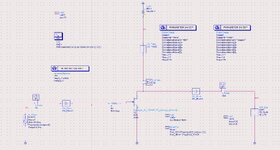
1. Schematic_Drawn_Using_ADS2022
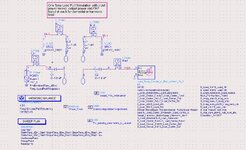
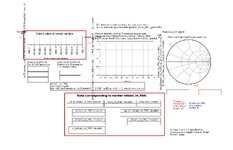
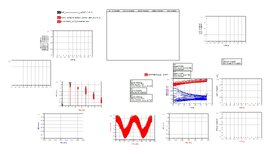
2. Obtaind_Output_Graphs
1. Desired_Ouput_Graphs
2. Desired_Ouput_Graphs_1
3. Desired_Ouput_Graphs_2
4. Desired_Ouput_Graphs_3
5. Schematic_1
Obtained Outputs are as follows:
1. Schematic_Drawn_Using_ADS2022
2. Obtaind_Output_Graphs
Attachments
-
 Desired_Output_Graphs_1.jpg104.5 KB · Views: 108
 -
 Desired_Output_Graphs_2.jpg201.9 KB · Views: 101
 -
 Desired_Output_Graphs_3.jpg96.1 KB · Views: 112
 -
 Schematic_1.jpg289.6 KB · Views: 118
 -
 Schematic_Drawn_Using_ADS_2022.jpg106.8 KB · Views: 106
 -
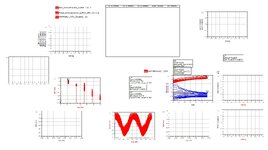 Obtained_Output_Graphs.jpg187.6 KB · Views: 102
 -
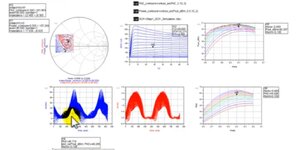 Desired_Output_Graphs.jpg123.4 KB · Views: 110
")