iVenky
Advanced Member level 2
- Joined
- Jul 11, 2011
- Messages
- 584
- Helped
- 37
- Reputation
- 76
- Reaction score
- 35
- Trophy points
- 1,318
- Location
- College Station, Texas
- Activity points
- 6,124
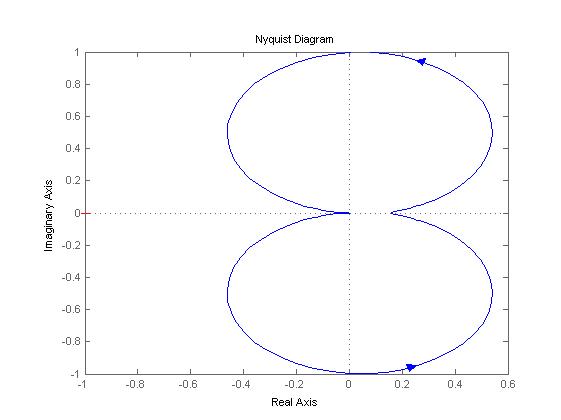
Actually I have plotted this for the function
e(½*t) * sin(2*pi*t)
This should mean that the system is unstable. But from the nyquist plot I am not getting it as stable. What I have read is this- If the amplitude( which is the radial length in the Nyquist plot) is greater than 1 then the system is unstable but what I get is less than 1.
Here's image

Thanks in advance.
e(½*t) * sin(2*pi*t)
This should mean that the system is unstable. But from the nyquist plot I am not getting it as stable. What I have read is this- If the amplitude( which is the radial length in the Nyquist plot) is greater than 1 then the system is unstable but what I get is less than 1.
Here's image
Thanks in advance.