bobilgner
Newbie level 5
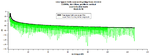
The attached figure is a comparison of the Free Space Path Loss (FSPL) from a point source against the power loss calculated using the 2D FDTD. The m along profile is the distance along a radial through the point source (at 2m). 0 gain for transmitter and receiver.
The black line is the FSPL calculation.
The pale green is the magnitude of the Poynting vector as calculated from the FDTD results. FDTD run in TE mode with cell spacing of 10cm.
I would have thought that the power in the signal would best be represented by an average of the Poynting magnitude, and not only the maxima.
Does anyone understand why only the Poynting vector magnitude maxima correspond to the FSPL values ?