littleheadyu
Newbie level 1
audio spectrum spikes
Hi,
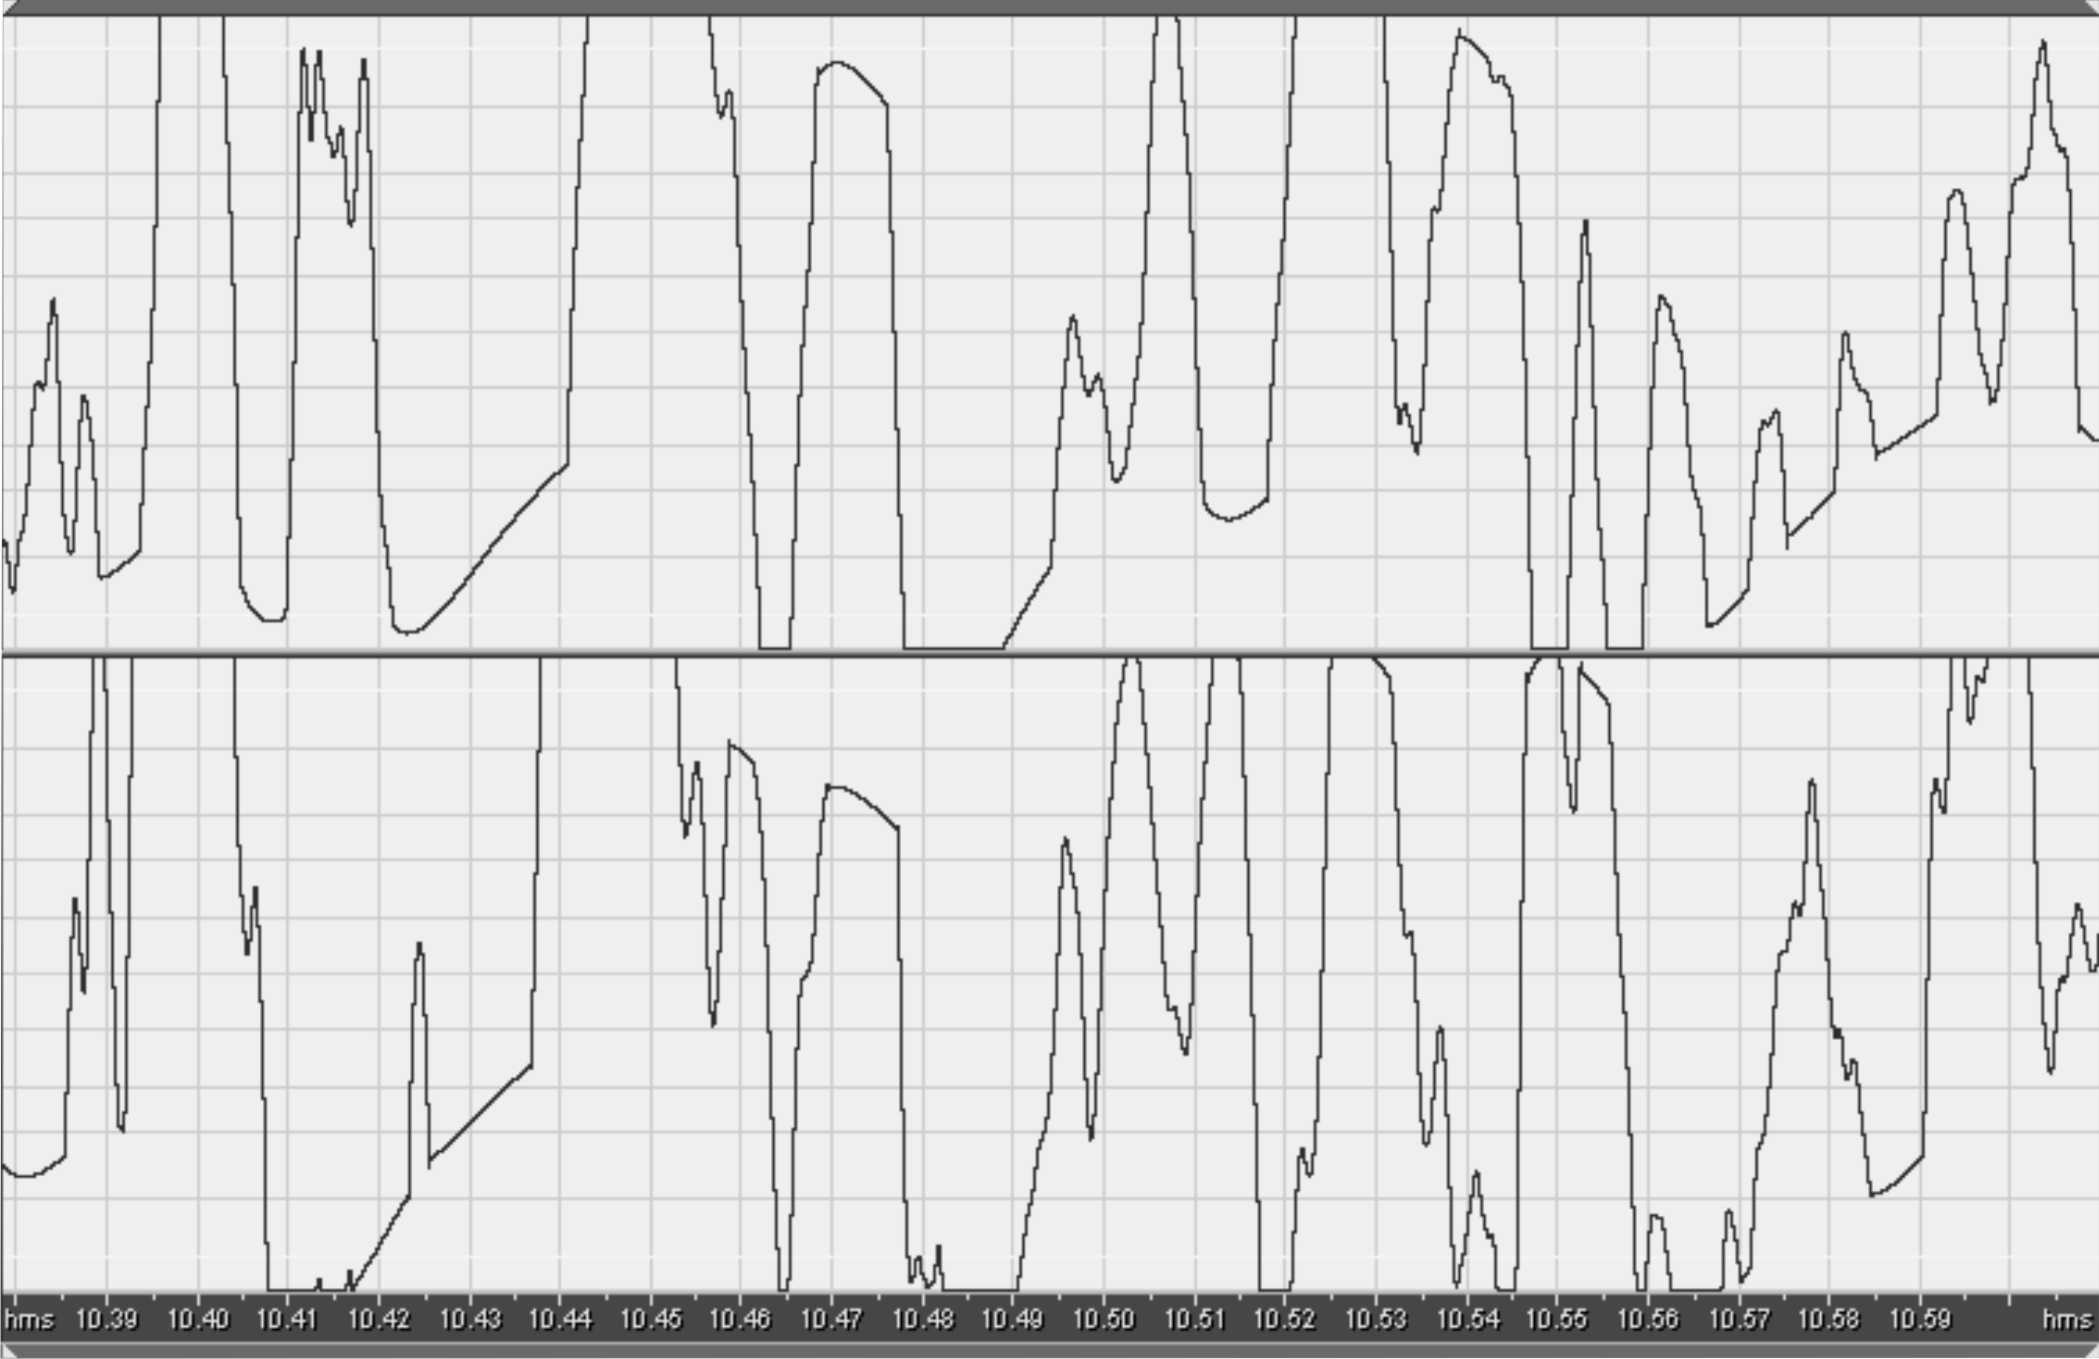
I am trying to analyze the spectrum of an audio .wav file which was recorded by someone else.
The .wav file has two tracks in it, so I just used one of them. The sampling rate is indicated in the file properties as 44 kHz.
I wrote the Matlab code as below:
sound=wavread('081029_08.wav');
a=sound") ,1);
,1);
b=abs(fftshift(fft(a)));
N=length(b);
Fs=44000;
f=(Fs/N)*(-N/2+1:N/2);
plot(f,b);
The spectrum seems strange, the spike is at f=0...
Can anyone explain the reason for me? I attached the .wav file with this post.
Thanks in advance!
Yuping
Hi,
I am trying to analyze the spectrum of an audio .wav file which was recorded by someone else.
The .wav file has two tracks in it, so I just used one of them. The sampling rate is indicated in the file properties as 44 kHz.
I wrote the Matlab code as below:
sound=wavread('081029_08.wav');
a=sound
,1);b=abs(fftshift(fft(a)));
N=length(b);
Fs=44000;
f=(Fs/N)*(-N/2+1:N/2);
plot(f,b);
The spectrum seems strange, the spike is at f=0...
Can anyone explain the reason for me? I attached the .wav file with this post.
Thanks in advance!
Yuping