Welcome to our site! EDAboard.com is an international Electronics Discussion Forum focused on EDA software, circuits, schematics, books, theory, papers, asic, pld, 8051, DSP, Network, RF, Analog Design, PCB, Service Manuals... and a whole lot more! To participate you need to register. Registration is free. Click here to register now.
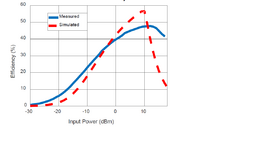
In addition to impedance of its PN junction, the diode also contains a certain amount of ohmic resistance. As you push greater Amperes through the component, ohmic resistance accounts for ever greater percentage of its total impedance. Thus efficiency drops after you reach a certain current level. (11 dBm on your graph.)
Heating effect makes a difference in measurements. The longer time that the current is applied, the more temperature rises, and the diode's efficiency drops.
It's no surprise if simulations differ from real-life measurements.
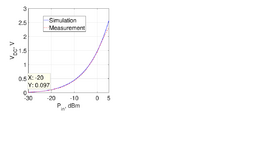
Follow this example to simulate the "Vout vs. Pin" graph.
ADS cannot directly simulate "Efficiency vs. Pin". To plot this graph, you will need to write a measurement equation to calculate:
n = Vout x Rload / Pin
This site uses cookies to help personalise content, tailor your experience and to keep you logged in if you register.
By continuing to use this site, you are consenting to our use of cookies.