neazoi
Advanced Member level 6
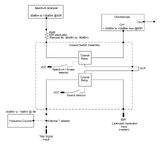
Hi, I have a 30khz to 180MHz generator. Is there a simple circuit that can convert its sine output to spikes, so I can use them to calibrate old scopes graticules in horizontal?
Follow along with the video below to see how to install our site as a web app on your home screen.
Note: This feature may not be available in some browsers.
I have to convert the sine from the generator to short duration pulses, say one pulse every peak of the sine. The rate of these pulses would depend on the sine frequency that way. These spikes will be used as markers in the time domain of old scopes that lack markers.zero-crossing detector, to start with. Define “spike”.
If the generator only goes to 180MHz you don't need 1GHz spikes, especially as time markers. If the 'old' scope can really display at 1GHz you can show several cycles between lower frequency markers.
It doesn't matter where on the sine wave you pick to generate the marker but the zero crossing will be by far the easiest to detect and it gives you two pulses per cycle. If you want peak detection you need to use a comparator and be sure exactly what voltage the peak is at. You can make a tracking comparator with a peak detector and a divider so it compares at slightly under the peak but it makes things somewhat more complicated.
If you are attempting to measure frequency using a signal generator to compare the waveform timing, a far simpler method is to feed the generator into the X input of the scope and the unknown into the Y input then tune the generator for a static image (like a Lissajous). You can then read the frequency directly from the signal generator. It will also work on harmonics of the generator.
Brian.
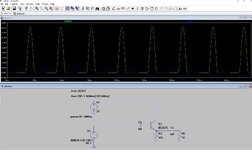
Interesting and dead easy. One spike per cycle! I wonder how well will this work on say 200mhz with components scaling maybe?Capacitor conducts brief spike whenever sine wave peaks. Current creates a voltage across R.
View attachment 184672
38mV is enough. The generator has +20dbm of drive power and the output spikes will be used as time markers, by changing the generator frequency and delay. Their amplitude does not matter much since I can reposition the trace to any amplitude of the test signal I want to time-measure. I wonder if this circuit will work at 200MHz and what component variations are appropriate for that frequency.Hi,
looks good so far.
But etter check the circuit including some realistic noise and amplitude fluctuation.
Is 38mV enough? from the description I rather expected 5V or so.
Klaus
It didn't work well in LTspice.A larger Farad value suits slower frequencies. I almost recommended a large value electrolytic type too for high frequencies but I've seen experts here tell how some types don't behave the same at high versus low frequencies.
The principle is that the capacitor charges to whatever maximum voltage is the waveform's peak, and then periodically carries a brief burst at each subsequent maximum.
The actual circuit I have used before, does have a resistor from the collector to the base to bias it. Without the resistor simulation shows even better results, that's all. I haven't tested this above 30MHz in real life.I doubt that would work well in real life. It isn't class C and the bias will be created by the input capacitor charging through the B-E junction of the transistor so the source impedance would be important. It would need at least some DC return path across the input for the bias to develop. At higher frequencies the parasitic capacitances in the transistor and the inductance of the capacitors would be sufficient to stop it working.
Brian.
I am not sure it is a frequency marker I need. What is needed is not to produce fixed harmonics of a low frequency signal but convert a variable generator signal to spikes. The spikes distance will be controlled by the frequency variation of the generator. Since the frequency is known (in a synthesized generator) the time difference between 2 spikes is known, hence they can be used as markers.Why not look for various existing frequency marker designs?
They typically use differentiated square wave or step recovery diodes as "spike" generator.