gnammy
Newbie level 3
Dear All,
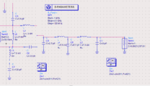
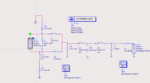
I am using a software of keysight which call ADS and I am simulating a balun with impedence matching. This is the circuit: (It shows in image ).
It is a balun which links a differential mode to single ended and after there is a impedance matching.In one side there is normal impedance 50 Ohm instead at the other side there is the impedance of antenna which is not adapted
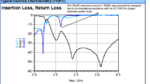
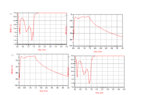
Now, I wanna obtain the S-Parameters, that is S_(11) and S_(12) similar to datasheet of antenna. (See datasheet antenna the graph where stay a lot of curves in different colours).
S_(21)-------->1.5 GHz corresponds -25 dB
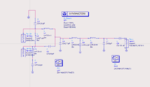
I did two simulation.
One -is when at left side is linked two resistance of 50 Ohm
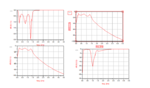
S_(21) ------>1.5 GHz corresponds -21 dB
Two-is when at left side is linked one resistance of 50 Ohm
S_(21) ------>1.5 GHz corresponds -18 dB
Now i think that the first way approaching to datasheet graph but it s not exactly.
What do you think about that? Is it correct my simulation?
I am using a software of keysight which call ADS and I am simulating a balun with impedence matching. This is the circuit: (It shows in image ).
It is a balun which links a differential mode to single ended and after there is a impedance matching.In one side there is normal impedance 50 Ohm instead at the other side there is the impedance of antenna which is not adapted
Now, I wanna obtain the S-Parameters, that is S_(11) and S_(12) similar to datasheet of antenna. (See datasheet antenna the graph where stay a lot of curves in different colours).
S_(21)-------->1.5 GHz corresponds -25 dB
I did two simulation.
One -is when at left side is linked two resistance of 50 Ohm
S_(21) ------>1.5 GHz corresponds -21 dB
Two-is when at left side is linked one resistance of 50 Ohm
S_(21) ------>1.5 GHz corresponds -18 dB
Now i think that the first way approaching to datasheet graph but it s not exactly.
What do you think about that? Is it correct my simulation?