Continue to Site

Welcome to EDAboard.com

Welcome to our site! EDAboard.com is an international Electronics Discussion Forum focused on EDA software, circuits, schematics, books, theory, papers, asic, pld, 8051, DSP, Network, RF, Analog Design, PCB, Service Manuals... and a whole lot more! To participate you need to register. Registration is free. Click here to register now.

Signal processing of a sampled signal

Status
Not open for further replies.

Poison_83

Newbie level 6
Joined
Apr 26, 2007
Messages
11
Helped
0
Reputation
0
Reaction score
0
Trophy points
1,281
Activity points
1,366
Hello!

I need some help with signal processing using matlab, i've got some sampled signals (the image is a clip from one of these). I want to get the signals without the dc-offset drifting and I want my signal to lay steady on 0 V and measure the peak-value off the signal.
How should I do this the simpliest way?
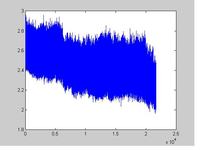
The sampled signal:
27_1179747086_thumb.jpg


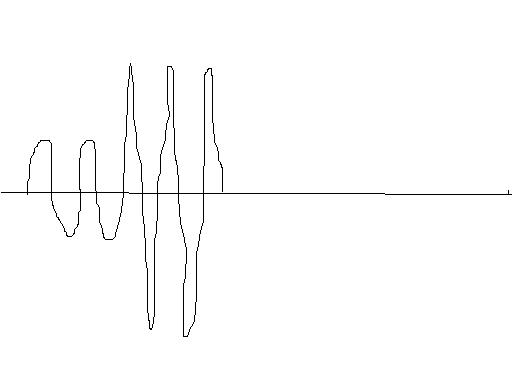
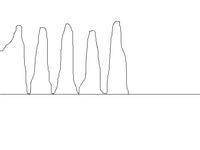
A little drawing of how I want the signal:
80_1179747788_thumb.jpg


Thanks!
 

Looks like you have a carrier at low frequency, would be good to filter it out, if you know what it is....

Could this work? Or is it just samples without known origin...?
 

thats a non linear operation anyway please be clear.

do you want, every local minima to lie on the 0V axis?

or only the minima of the whole signal? (if this is the case: just subtract the signal with the minima value
 

tzushky:
No its not a carrier, its not o constant frequency.
The signal is sampled from a piezoacoustic sensor for detection of human breath.

mondunno:
I want it like you mention first, to make every local minima lie on the 0V axis.
If that is possible?
 

Hi
I agree with tzushky, original signal contains Low frequency content which caused the drift.
this is the usual case when processing Biomedical signals & low freq. content is due to "MOTION ARTIFACT".

first of all use a LP filter to omit DC of your signal.
the result will have zero average.figure above shows a zero-DC signal :

22_1179791998.jpg


since your data is periodic with only 1 local minimum in each period (I refer to your figure)
and with approximately constant period ~ 14 breaths/min.

therefore (after LP filtering) you can easily drift your signal in each period
with amount of minimum of that interval.

this should solve your problem ,but
if you are still not staisfied ,I have a general algorithm .so if you wanted to go further you better tell me.

hope it helped
Armin
 

armin:

I assume that you mean a HP-filter instead of LP to eliminate the DC level?
I´ve tried with some HP-filters with a very low cutoff, about 0.1Hz.
But as I said in the earlier post the goal is to have the signal positive and laying on top of a 0V baseline.
Yes I'm very interesting in some algorithm for this problem.

Here is a picture of a whole signal showing how the DC-level appears:
91_1179793696_thumb.jpg
 

Hi Poison

could you upload original data for me ?

thanks
Armin
 

Yes of course I can do that.

This is a .txt file with sample, time and voltage.
 

May I ask what is the interest of having all minima on 0V line? What information can that give you? I'm not familiar with medial applications, so if you have the time could you give me a hint?

Thanks
 

To clamp the bottom of each cycle to zero, the signal needs to be distorted in some way. What ways are acceptable to you?

The signal contains many small high-frequency blips, possibly noise. You may want to attenuate them before performing the zero-clamping operation.

If you can describe the overall measurement goal, maybe someone can suggest a different or easier approach than the zero-clamping operation.

Can you provide a small MATLAB data read statement that parses your data file?
 

By the look of it, it looks like a low frequency signal ADDED to a high frequncy signal. If this the low frequency one available elsewhere or known in advance, you can just subtract it from the signal. You can laso try subtracting away your LPF output from the signal.

But these methods assume that there is no change in the peak amplitude of the high frequency component. if not, what you say cant be achieved without somehow distorting as already mentioned. Would be interesting to know what characteristic of this "zero-based signal" that you are trying to generate is of interest and if there is some other way to fin that.

-b
 

Thank you for your answers!

No maybe it's not necessary at all to make it this way, it was just an idea I had...

The overall goal for the project is to measure the peak-peak value of the signal in intervals, for example 40-60 sec and 100-120 sec and so on.
In this intervals it's theoreticaly the mean pk-pk value that is interesting (but it may be unwanted transients in this intervalls that must be eliminated). This values should be saved and compared to earlier values.
The first idea was to eliminate the DC-component with some active filtering and then through a ADC and use a microcontroller to make the calculations.
Is this the best way to solve the problem, or some other ideas?
Thank you for your proposals...
 

Someone who maybe can help me with some ideas?
 

Status
Not open for further replies.

Part and Inventory Search

Welcome to EDABoard.com

Sponsor

Back
Top