abr_pr90
Newbie level 3
Hi,
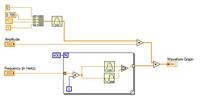
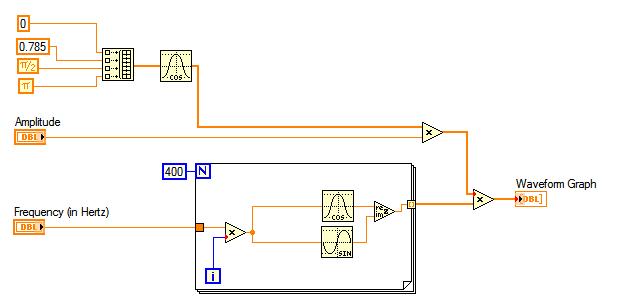
I'm trying to generate waves of the form, p = a*cos(theta)*exp(i*w*t), where t is the time, w is the frequency and theta is just an angle. In my VI (attached),
I used exp(i*w*t) = cos(w*t)+i*sin(w*t) and formed this using the Re/Im to Complex Function. And I used four different values of theta.
However, when I output the values on a graph I only see a straight line, rather than time-varying sinusoidal waveforms. When I output just the exponential part (without multiplying by different values of theta) I do get a sinusoidally varying waveform. Also, I only get a single line on the graph, even though I'm expecting to obtain four different waveforms corresponding to the four different theta values I used. I suspect that it's something to do with building arrays, but can't quite figure out why.
Thanks for the help.
Ruf.
Attachments: