Continue to Site

Welcome to EDAboard.com

Welcome to our site! EDAboard.com is an international Electronics Discussion Forum focused on EDA software, circuits, schematics, books, theory, papers, asic, pld, 8051, DSP, Network, RF, Analog Design, PCB, Service Manuals... and a whole lot more! To participate you need to register. Registration is free. Click here to register now.

Power spectrum of sinusoid processed with a Hann window has multiple traces?

Status
Not open for further replies.

Souljah44

Junior Member level 1
Joined
Feb 17, 2009
Messages
17
Helped
0
Reputation
0
Reaction score
0
Trophy points
1,281
Activity points
1,445
Hi All,


This is my first ADC and verifying it is proving to be more difficult then actually designing the sub-blocks.
I have been able to do a transient simulation in cadence (
Spectre) and have successfully imported the data into matlab.
This is where I'm encountering most of my HEADACHE.

1) I'm new at matlab

2)All of the fft examples I've seen use as input a time varying signal defined as a function. The data that I have is in a table form: transient output with respect to time.
Do I have to build a function from the data that I imported?

2) In order to familiarize myself with the procedure of getting my SNR I've used an ideal sinusoid as an example and gone all the way up to APPLYING a Hann window to the signal.

I'm hoping someone can help me with these questions:

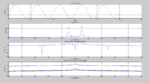
a) Please refer to the attachment: he last plot, is supposed to be the power spectrum of the windowed signal. Can someone explain to me why there are lot of traces of it. Am I doing something wrong or am I wrong to expect a SINGLE trace. I'm basically trying to compare the power of the signal in two cases: windowed (with hann) and unwindowed.

b) Ultimately, I'll be extracting the SNR of my real ADC with a hann window applied to the output. What is the ideal bandwidth that I have to consider to do the SNR measurement in?

Here is my matlab code for the attached results:
Code:
clear all;
close all;
clf;

fbw=50;%for tutorial example
deltaT=0.001;%time between SAMPLES
fs=1/deltaT; %sampling frequency

FFTOSR=64;%extra OSR for fft
OSR=fs/(2*fbw);%sampling OSR
NFFT=2048;%size of FFT

nVals=fs*(-NFFT/2:NFFT/2-1)/NFFT;%Normalizing expression

cycle=5;
period=1/fbw;
t = 0:deltaT:cycle*period;
freq=[0:fs:1/(cycle*period)];
x = sin(2*pi*fbw*t);%signal to be SAMPLED
subplot(4,1,1);
y = x;
L=length(y);
plot(y);
grid on
title(['Sine Wave f=', num2str(fbw), 'Hz']);
xlabel('Time(s)');
ylabel('Amplitude');
%
%FFT and plots
%
Y = fftshift(fft(y,NFFT));
subplot(412);
plot(nVals,abs(Y));
grid on;
title('magnitude of FFT');
xlabel('Frequency(HZ)');
ylabel('Magnitude');

Pyy = (abs(Y).^2) / (NFFT*L);
Pyydb=dbp(Pyy);
subplot(413);
plot(nVals,Pyydb);
title('power over entire spectrum unwindowed');
xlabel('Frequency(HZ)');
ylabel('Power dB');
grid on;


%
%Apply Hann window
%
w=hann(NFFT);
nb=3;
w1=norm(w,1);
w2=norm(w,2);
NBW=(w2/w1)^2;

%FFT of Hann windowed signal and plot
V=fftshift(fft(w*y)/(w1/2));
Pvv = abs(V.^2) / (NFFT*L);
Pvvdb=dbp(Pvv);
subplot(414);
plot(nVals,Pvvdb);

title('power over entire spectrum with hann window');
xlabel('Frequency(HZ)');
ylabel('Power dB');
grid on;

Thanks!
 

Attachments

  • matlaboutput_ideal_sinusoid_fft.PNG
    matlaboutput_ideal_sinusoid_fft.PNG
    46.3 KB · Views: 134
Last edited by a moderator:

Hi Souljah44,

You are right to expect a single trace. The problem is in the matrix multiplication. To resolve, in your code you may change the following lines as follows:
w=hann(NFFT); => w=hann(length(y));
V=fftshift(fft(w*y)/(w1/2)); => V=fftshift(fft(w.*y',NFFT)/(w1/2));
 
Thank you amaximus. Any thoughts on how wide my frequency range from the center should be for my sndr calculation? Any rule of thumb?
I'm currently using this piece of code and my SNR is awful -26dB which can't be right.
Thanks.

Code:
signal_bins=[0:(nb-1)];
inbands_bins=0:NFFT/(2*OSR);
noise_bins=setdiff(inbands_bins,signal_bins);
snr=dbp(sum(abs(V(signal_bins+1)).^2)/sum(abs(V(noise_bins+1)).^2));
 

In your code actually there is no inserted noise. All you have is a clean sine wave, so technically, you should get infinite SNR in this case. In your FFT result, you are getting some sidebands in the frequency spectrum, which must be artifacts of FFT. I suspect you are having incoherent sampling. You should google and read about "Coherent Sampling", which is critical for FFT.
 

Hi,

I'm not sure if iunderstand the problem...
Is this correct? You built an ADC and now want to test it. You generated an analogue sine wave, fed it to the ADC an safed the digital data to process them.
If so, then try to generate the analog sine wave with the same clock as the ADC sample rate. Generate the sine with 2^n points.
With this you can get rid of the fft windowing. The results are single spectral lines.

If your analog signal is other integer division than 2^n of sample clock frequency you could use DFT instead of FFT.

Klaus
 

Hi,

I'm not sure if i understand the problem...
Is this correct? You built an ADC and now want to test it. You generated an analogue sine wave, fed it to the ADC an safed the digital data to process them.
If so, then try to generate the analog sine wave with the same clock as the ADC sample rate. Generate the sine with 2^n points.
With this you can get rid of the fft windowing. The results are single spectral lines.

If your analog signal is other integer division than 2^n of sample clock frequency you could use DFT instead of FFT.

Klaus

Hi Klaus,

I had to take some time to resolve some circuit issues I was having. Anyway, let me clarify:
1) I built and adc in cadence virtuoso with real components so the output stream I obtain has real non-idealities.
2) I processed the output stream with ocean and computed my SNDR with spectre.
3) I exported the same data from step 2 above as a CSV file to analyze it and determine my SNDR with matlab to confirm the number I received in cadence. This is what I need help with.
a) what form should my cadence data be in in order for matlab to properly analyze it?
b) how big should my signal bandwidth be to adequately calculate SNDR with hann window?
c) Does anyone have a cookbook step by step procedure from generating the raw cadence data to obtaining the SNDR in matlab?

Hope this is clear.

Thanks.
 

Hi,

Sorry i can´t help you with matlab...

****
b) how big should my signal bandwidth be to adequately calculate SNDR with hann window?
this should be determined by the engineer.
My opinion: i´d go up to fs/2 (according nyquist).
If an industrial ADC is specified with max sampling rate of 100.000 ksmpl/s then i´d use this as sample freq. and SNDR calculation up to 50.000 kHz
For an an audio ADC with a typical fs of 44.100 smpls/s and max fs = 100.000 smpl/s i´d test it with the typical fs of 44.100 smpls/s and SNDR calculation up to 22.05kHz
(exceptions are ADCs that especially are built for undersampling)

***

I reviewed your posts.

it seems to me you are using
* a 50Hz input sine wave
* with 100% max amplitude
* a sampling rate of 1ms --> 1kHz
* An FFT with 2048 points

I have some experience with testing ADCs, production test of a big ADC manufacturer.

I hope you don´t mind my recommendations.

* In real tests one does not use 100% input range. Maybe 95% to avoid clipping signals caused by offset and/or gain errors of the ADC.
* If using FFT one tries to use that the sample frequency is 2^n of analog frequency.
if you need analog frequency fa to be 50HZ, then Fs = 16 x fa or 32 x fa. fs = 800Hz or 1600Hz
or if you need 1kHz sample frequency --> then fa = 31.25Hz or 62.5Hz

--> then you don´t need windowing. You get best results with sharp peaks from FFT, and calculation of SNDR and so os is easy.

with the use of a window you always get those (not nice) arcs in the result of the FFT.

Maybe it´s worth a try.

Good luck

Klaus
 

Status
Not open for further replies.

Similar threads

Part and Inventory Search

Welcome to EDABoard.com

Sponsor

Back
Top