Continue to Site

Welcome to EDAboard.com

Welcome to our site! EDAboard.com is an international Electronics Discussion Forum focused on EDA software, circuits, schematics, books, theory, papers, asic, pld, 8051, DSP, Network, RF, Analog Design, PCB, Service Manuals... and a whole lot more! To participate you need to register. Registration is free. Click here to register now.

Phase Margin Measurement in HSPICE

Status
Not open for further replies.

emeraude

Junior Member level 2
Joined
Mar 2, 2011
Messages
22
Helped
1
Reputation
2
Reaction score
1
Trophy points
1,283
Location
Philippines
Activity points
1,458
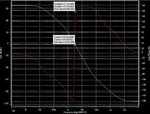
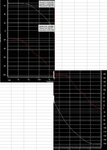
I'm quite confused on how to measure phase margin in HSPICE (please see attached file). My unity gain frequency is 3.12MHz. The corresponding phase at f=3.12MHz is 157 degrees. So what is my PM then? Is it 180-157=23? or 180+157=337? I'm confused..In any case, is it bad or good? Pls help. Thanks!
 

Attachments

  • PM Plot.JPG
    PM Plot.JPG
    80.1 KB · Views: 342

My unity gain frequency is 3.12MHz.
The corresponding phase at f=3.12MHz is 157 degrees.
So what is my PM then? Is it 180-157=23? or 180+157=337?
Your phase plot is wrapped phase.

Plot phase as unwrapped phase.

I think phase at 3.12MHz is -180deg(=+180-360).

In any case, is it bad or good? Pls help.
Not good.
PM=40~60deg is preferable.
 
Last edited:
For my opinion, the displayed reading (1.57e2) is not correct. I can read 180 deg. corresponding with a margin of PM=0 deg.
It`s at the stability limit!
 
Hi Pancho_Hideboo! What do you mean by wrapped phase? How should I unwrapped the plot?How come my PM at 3.12MHz is -180 (=+180-360) Please explain further. Thanks... Hi LvW! I'm still confused. How come my PM=0 deg and Pancho_Hideboo is saying that its -180 deg? I though i should look at it at my unity gain frequency = 3.12MHz w/c corresponds to 157 deg. And why are you saying that its at the stability limit even my PM=0 deg? Please explain further. Thank you very much.
 

........ Hi LvW! I'm still confused. How come my PM=0 deg and Pancho_Hideboo is saying that its -180 deg? I though i should look at it at my unity gain frequency = 3.12MHz w/c corresponds to 157 deg. And why are you saying that its at the stability limit even my PM=0 deg? Please explain further. Thank you very much.

Hi emeraude, let me explain:

As I said, the displayed phase information on your first diagram is not correct. It can be seen that the phase function crosses the 180 deg line at a gain magnitude of 0 dB. The error in displaying the phase (157 deg) arises probably due to the sharp jump from minus to plus caused by the post-processing unit of the simulator.
Another indication of the 180 deg phase is the SLOPE of the gain function , which is app, -40 deg/dec. at the gain cross-over frequency.
As a consequence, your simulation results comprise all the units of the open loop WITHOUT the sign inversion that takes place by closing the loop (negative feedback). This would give additional 180 deg phase shift - resulting in -360 deg in total. That means: Stability limit (Phase margin PM=0). Does this help?
LvW
 
Hi LvW,
I completely agree with your regarding the phase margim equal to 0 (that is, the Stability limit).

a) However, I have not understood what you explained with “without the sign inversion that takes places by closing the loop (negative feedback)”. Please, could you explain?
b) By the way, do you know the HSPICE command to plot phase at a node? The same that emeraude has used.

Thank you very much,

Hi Palmeiras,

(a) the explanation is simple:
The stability limit is at a loop gain LG=1 (magnitude 0 dB and phase=0 deg resp. -360 deg).
Normally, the closed loop consists of several components (amplifier, feedback elements) that constitutes a NEGATIVE feedback with a minus sign closing the loop (in hardware: difference between input and feedback signal).
Now - very often (and also in this case as indicated by 0 deg for low frequencies) the BODE diagram shows only the transfer function of the loop WITHOUT the mentioned minus sign.
In this case the stability limit is - of course - at -180 deg.
Without this sign inversion we have always positive feedback for dc resulting in a loop that is always unstable (saturation, no opereating point) independent on the phase response for higher frequencies.
(b) Sorry, I am not familiar with HSpice.
 
Thanks Pancho-hideboo, now I understand why my PM=-180 deg... I dont have any other tool besides from Avanwave. Isn't it accurate? What type of plotting tool or design tool can you suggest which is more accurate than what I'm currently using.

Thanks LvW for the explanation. I'll bear that in mind... My design is not yet optimized as you can see in my gain plot. I'm just trying to check how to read my open loop PM. Correct me if I'm wrong, so you're saying that based from my plot my PM is 0 deg (+180 - 180 = 0 deg)... Shouldn't it be PM = +180 - 360 = -180deg? Since it crosses additional 180 deg phase shift resulting to -360 deg?
 

emeraude, perhaps my explanation was not clear enough. I repeat: The margin is ZERO !
I suppose, you try to design a stable circuit.
In this case, there is an absolute requirement that at DC ( 0 Hz) there must be NEGATIVE feedback (phase -180 deg).
The phase response in your diagram starts at ZERO deg. That means, you did NOT simulate the complete open loop, but only the series combination of all loop components WITHOUT the phase inversion for negative dc feedback.
That means: In order to obtain the real loop gain you have to add -180 deg to the shown phase response.
Result: At the gain cross-over frequency you have a total phase shift of -360 deg - resulting in a margin of ZERO (stability limit). Is it clear now?
LvW
 

now I understand why my PM=-180 deg...
Wrong.
Gain is varied like following:
64dB(100Hz), 0dB(3.12MHz), -96dB(100GHz)
Unwarpped phase is varied like following:
0deg(100Hz), -180deg(3.12MHz), -360deg(100GHz)

PM is 0deg for your case. PM=-180-(-180)=0

Again PM=40~60deg is preferable.

I dont have any other tool besides from Avanwave.
Isn't it accurate?
It is accurate.
Maybe you can't plot unwrapped phase in Synopsys AvanWave.
But it could not be problem, if you can understand your wrapped phase correctly.

What type of plotting tool or design tool can you suggest which is more accurate than what I'm currently using.
I use Agilent ADS post processing environment or Cadence post processing environment even for results of Synopsys HSPICE.
unwrap() - ADS 2009 - Agilent EEsof Documentation Center
See my appends in The Designer's Guide Community Forum - PRBS pattern for eye diagram USB FS driver...

As another option, you can use Mathworks MATLAB for post processing of results of Synopsys HSPICE.

I have not confirmed whether it is possible in Synopsys CosmosScope or Synopsys Wave Viewer.
 
Last edited:
Status
Not open for further replies.

Similar threads

Part and Inventory Search

Welcome to EDABoard.com

Sponsor

Back
Top