Marvin_G
Junior Member level 3
hye,can some1 help me here..below is my code..i keep getting error which is "undefined variable w"..and i have no idea why...please help me..tq
clf;
M = input('Please enter the filter length M:');
w = 0:2*%pi/1023:2*%pi;
num = (1/M)*ones(1,M);
den = [1];
// Compute and plot the DTFT
h = freqz(num, den, w);
subplot(2,1,1)
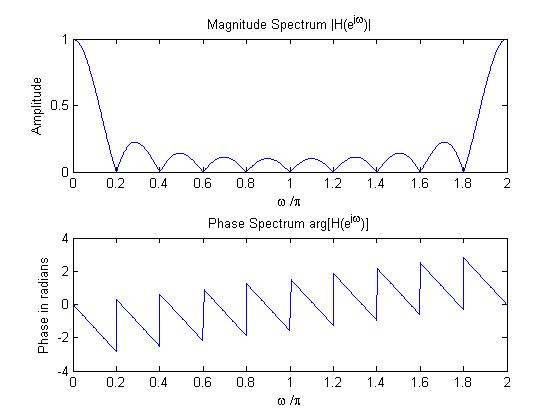
plot(w/%pi,abs(h));mtlb_grid
title('Magnitude Spectrum |H(e^{j\omega})|')
xlabel('\omega /\%pi');
ylabel('Amplitude');
subplot(2,1,2)
plot(w/%pi,angle(h));mtlb_grid
title('Phase Spectrum arg[H(e^{j\omega})]')
xlabel('\omega /\%pi');
ylabel('Phase in radians');
clf;
M = input('Please enter the filter length M:');
w = 0:2*%pi/1023:2*%pi;
num = (1/M)*ones(1,M);
den = [1];
// Compute and plot the DTFT
h = freqz(num, den, w);
subplot(2,1,1)
plot(w/%pi,abs(h));mtlb_grid
title('Magnitude Spectrum |H(e^{j\omega})|')
xlabel('\omega /\%pi');
ylabel('Amplitude');
subplot(2,1,2)
plot(w/%pi,angle(h));mtlb_grid
title('Phase Spectrum arg[H(e^{j\omega})]')
xlabel('\omega /\%pi');
ylabel('Phase in radians');