Continue to Site

Welcome to EDAboard.com

Welcome to our site! EDAboard.com is an international Electronics Discussion Forum focused on EDA software, circuits, schematics, books, theory, papers, asic, pld, 8051, DSP, Network, RF, Analog Design, PCB, Service Manuals... and a whole lot more! To participate you need to register. Registration is free. Click here to register now.

Matlab Power spectrum for analogue signal

Status
Not open for further replies.

zaed_salah

Newbie level 4
Joined
May 1, 2010
Messages
5
Helped
0
Reputation
0
Reaction score
0
Trophy points
1,281
Activity points
1,310
Hello everyone

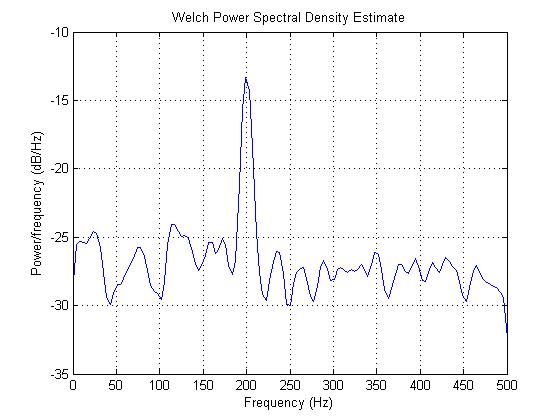
I am newbie in Matlab, and I want to generate and plot power spectrum density for analogue signal , using dsp.data.psd.

Any help??

Thanks
 

type in the help window of matlab the words (power spectral density) you will get some results may help you, see this example:

Fs = 1000;
t = 0:1/Fs:1;
% 200Hz cosine + noise
x = cos(2*pi*t*200) + randn(size(t));
pwelch(x,128,120,[],Fs,'onesided')

 
Status
Not open for further replies.

Similar threads

Part and Inventory Search

Welcome to EDABoard.com

Sponsor

Back
Top