Continue to Site

Welcome to EDAboard.com

Welcome to our site! EDAboard.com is an international Electronics Discussion Forum focused on EDA software, circuits, schematics, books, theory, papers, asic, pld, 8051, DSP, Network, RF, Analog Design, PCB, Service Manuals... and a whole lot more! To participate you need to register. Registration is free. Click here to register now.

IV curves - Simulation of a diode

Status
Not open for further replies.

jayce3390

Full Member level 6
Joined
May 22, 2007
Messages
351
Helped
29
Reputation
58
Reaction score
21
Trophy points
1,298
Activity points
3,287
I am trying to create an electrical model of a PV solar pannel. Lot of documents give the equivalent model which is composed of a current source, a diode and 2 resistors.
Typical I = f(V) of a solar pannel is described as the following picture.
72_1268503897.jpg

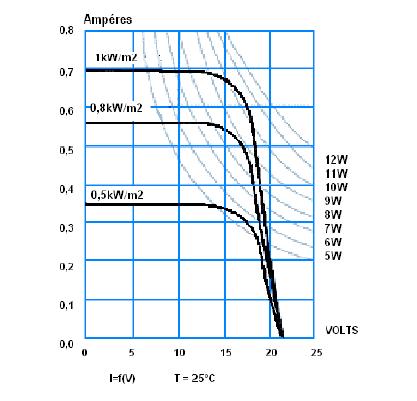
[url=http://obrazki.elektroda.pl/16_1268503897.jpg][img]
[img][url=https://obrazki.elektroda.pl/46_1268670543.jpg][img]https://obrazki.elektroda.pl/46_1268670543_thumb.jpg[/url]
I don't know how to get same IV curves with the shown simulation I performed.

Could you tell me where I am wrong? I really don't know where I am mistaking...

Thank you for the support.

david
 

Please, could you have a short look on my issue...
 

I am not sure which plots are the ones you are getting and which ones are the ones you want, but I have followed the Intusoft method here:

http://www.intusoft.com/nlhtm/nl78.htm#ref2

and get some sensible results. It didn't seem as straightforward as it should be though!
With my simulator I set up the following in addition to what you can see in the schematic:

.param imax=0.33
.param vmax=21
.param is=1e-11
.param n={vmax*38.6/log(imax/is)}
.model DTEST d(is={is} n={n} xti={3*n} eg={1.11*n})

This is equivalent of what they are doing with the text at the side but in a "standard" syntax (I think).

The simulation I ran was with a fixed I1 current using:

.DC Rload 1 100 198.396793587174m

This sweeps the load from 1 ohm to 100 ohms. The strange step size is simply the simulator calculating the step size to make it 100 steps in the sweep.

Then, the optimum power curve comes from plotting power in the load on the Y axis against output voltage on the X axis. The current curve is from plotting output current against output voltage. Both of these plots require you to plot graphs against something other than what you swept in the DC analysis. You may not be used to doing this as it is not the normal way of doing things.

You need to set up a diode model as described to get the correct results, although it should really be based on your own solar panel values.

So, I think your problems are probably one or more of the following:

1. not creating the diode model,
2. not sweeping the right parameter (Rload)
3. not plotting the right parameters (in particular, the X axis is Vout).

So, while the model is very simple, the implementation of it is a bit tricky!

I hope that helps.

Keith.
 

    jayce3390

    Points: 2
    Helpful Answer Positive Rating
Status
Not open for further replies.

Part and Inventory Search

Welcome to EDABoard.com

Sponsor

Back
Top