azannn
Newbie level 4

- Joined
- Jun 21, 2013
- Messages
- 5
- Helped
- 0
- Reputation
- 0
- Reaction score
- 0
- Trophy points
- 1
- Activity points
- 35
Hello everyone,
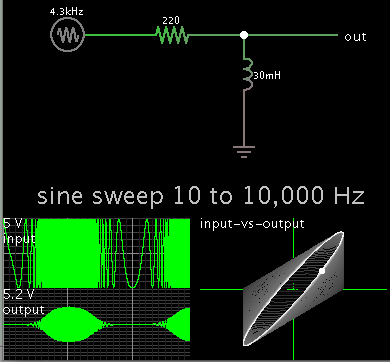
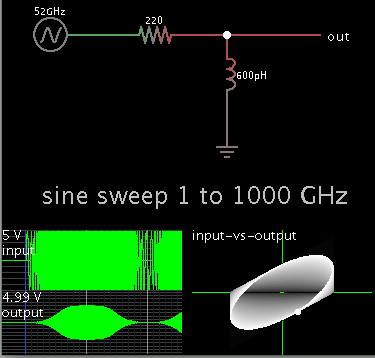
i want to make a RLC circuit simulation and display the variations of the inductance with frequency (so x axis = freq and y axis = inductance). I made researches on internet but all i got is a sort of S parameters simulation where i can extract the values of inductance. I didn't understood what was S parameters and even more the simulation on these parameters. So i want to ask if there's a direct simulation to display the inductance's variations or it's the only way by using the S parameters ? and how can i use these parameters to reach the inductance's variations ?
Thanks everybody


