Continue to Site

Welcome to EDAboard.com

Welcome to our site! EDAboard.com is an international Electronics Discussion Forum focused on EDA software, circuits, schematics, books, theory, papers, asic, pld, 8051, DSP, Network, RF, Analog Design, PCB, Service Manuals... and a whole lot more! To participate you need to register. Registration is free. Click here to register now.

how to write a programe in MATLAB to generate clean signal.

Status
Not open for further replies.

dmiriy10

Newbie level 1
Joined
Apr 20, 2009
Messages
1
Helped
0
Reputation
0
Reaction score
0
Trophy points
1,281
Activity points
1,287
matlab generate signal

Hi Dear, can any one explain me, how to write a programe in MATLAB to generate clean signal and adding noise to it ....... especially for bearings.....

Thanks
 

program e^x in matlab

Hey .... Elaborate ur Query........... Wat type of clean signal You require...

Is it u require discrete Sin, Cos , exponenetal, simple pulse strain.......

below is a command for generating x[n] = [1 0 1 3 1]
where n = -2 to +2

----------------------- Matlab Command------

n=-2:1:2;
x=[1 0 1 3 1];
% To plot the data

stem(n,x);

Now to Add Noise....... Which type of Noise U require that u have to decide first....
Whether its White Gaussian Noise , Rayleigh Noise , .........

depending upon requirement there are inbuilt functions to generate pdf of noise.... gauss , rayleigh ... ricean... etc

Then Convolute obtained PDF with ur Message signal........ to obtain a signal containig noise..........
 

generate signal in matlab

Matlab Help:

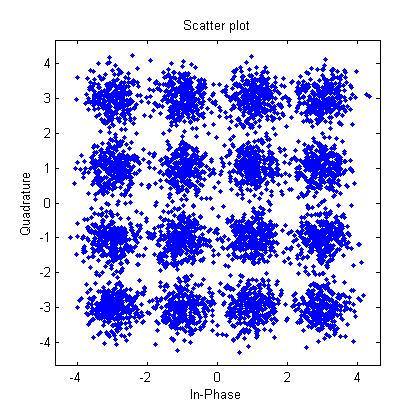
The example generates a random digital signal, modulates it, and adds noise. Then it creates a scatter plot, demodulates the noisy signal, and computes the symbol error rate. For a more elaborate example that is similar to this one, see Modulating a Random Signal.

% Create a random digital message
M = 16; % Alphabet size
x = randint(5000,1,M);

% Use 16-QAM modulation to produce y.
y=modulate(modem.qammod(M),x);

% Transmit signal through an AWGN channel.
ynoisy = awgn(y,15,'measured');

% Create scatter plot from noisy data.
scatterplot(ynoisy);

% Demodulate ynoisy to recover the message.
z=demodulate(modem.qamdemod(M),ynoisy);

% Check symbol error rate.
[num,rt]= symerr(x,z)

The output and scatter plot follow. Your numerical results and plot might vary, because the example uses random numbers.

num =

83


rt =

0.0166

44_1240423346.jpg


The scatter plot does not look exactly like a signal constellation. Where the signal constellation has 16 precisely located points, the noise causes the scatter plot to have a small cluster of points approximately where each constellation point would be.

oooooooooooooooooooooooooooooooooooooooooooooooooooooooooooooooooo
**broken link removed**
oooooooooooooooooooooooooooooooooooooooooooooooooooooooooooooooooo

Added after 2 minutes:

by the way, I am agree with konarkk
 

Status
Not open for further replies.

Similar threads

Part and Inventory Search

Welcome to EDABoard.com

Sponsor

Back
Top