Continue to Site

Welcome to EDAboard.com

Welcome to our site! EDAboard.com is an international Electronics Discussion Forum focused on EDA software, circuits, schematics, books, theory, papers, asic, pld, 8051, DSP, Network, RF, Analog Design, PCB, Service Manuals... and a whole lot more! To participate you need to register. Registration is free. Click here to register now.

How to use the Matlab command FFT to convert voice time domian to frequency domain?

Status
Not open for further replies.

intelnside

Member level 2
Joined
Jun 6, 2006
Messages
42
Helped
4
Reputation
8
Reaction score
1
Trophy points
1,288
Activity points
1,580
Can anyone guide me how to using the matlab command fft to convert voice time domian to frequency domain?
please teach me...:cry:
 

what is the amplitude means after fft

try spectogram to get a spectrum.
try audacity free sw to see the spectrum.

cheers
srinivas
 

wavread fft matlab

can teach me clearly using the spectrogram?
Another question:
please...because after i convert my noise time domian to freq doman, after that i need to filter out the unwanted noise. please...
if design filter just only can use freq domain , rite?
 

time domain to frequrncy domian in matlab

Hey You!

pls, help beginners sometimes. i need the solution manual for gonzalez book 2nd edition. pls help me?

I know you will help me!

thx
 

fft hertz matlab

using matlab for fft command is simple..
just read the voice file as an array of data and apply fft and display the spectrum.
to remove the dc component use fftshift.
 

dc mean fft length dt

%Copy this code and run it in MATLAB
% Use mic to record sound ;test ur mic using windows recorder
%
Fs = 11025;
y = wavrecord(5*Fs,Fs); %Recording sound for 5 sec
t=[0:1/Fs:(length(y)-1)/Fs];
subplot(211)
plot(t,y),title('Time Domain Speach Signal'),xlabel('Time (t) '),ylabel('Amplitude')
[H,W]=freqz(y,1,2048,Fs);
subplot(212)
plot(W,abs(H)),title('Frequency Spectrum'),xlabel('Frequency (Hz)'),ylabel('Ampltide')
 

remover dc fft matlab

voice=wavread('file_name');
fvoice=abs(fft(voice));
plot(fvoice(1:25000))

the file--> 'file_name' must be in your current work directory..

for lp filtering..

butter(2,0.2);

AMRITH.S.


intelnside said:
Can anyone guide me how to using the matlab command fft to convert voice time domian to frequency domain?
please teach me...:cry:

Added after 2 minutes:

try thiis out (along with filtering),

close all;
clear all;

voice=wavread('file_name');
fvoice=abs(fft(voice));
plot(fvoice(1:25000));hold on;
[n d]=butter(2,0.1);
ff=filter(n,d,voice);
plot(abs(fft(ff)),'red')

hope u would also get it.

AMRITH.S.

intelnside said:
Can anyone guide me how to using the matlab command fft to convert voice time domian to frequency domain?
please teach me...:cry:
 

frequency vector matlab

matlab help is the best place for learing fft you can try it firstly
matlab demo is another choice
 

matlab fft issues

Hi,

You need also some DSP knowledge about DFT, IDFT and windowing techniques. I think that you need approprioate window function and FFT.
 

matlab fft problem

thank man, i will try it...

Added after 9 minutes:

guyz, i still got 1 more problem, if i wan to find the coefficient , its that using tis comand?
" [B,A] = cheby2(2,40,[Freq1, Freq2]);"
 

time shift fft matlab

hi

u go to the Matlab help ,enter the fft in search u will get full details of fft
 

design filter wavread fft

I think yes but type help cheby2 in matlab it will guide you through
 

frequency domain plot

khubaibahmed, why ur code not using FFT to find the frequency spectrum?

Added after 24 minutes:

i oso got my code to find the frequency spectrum...
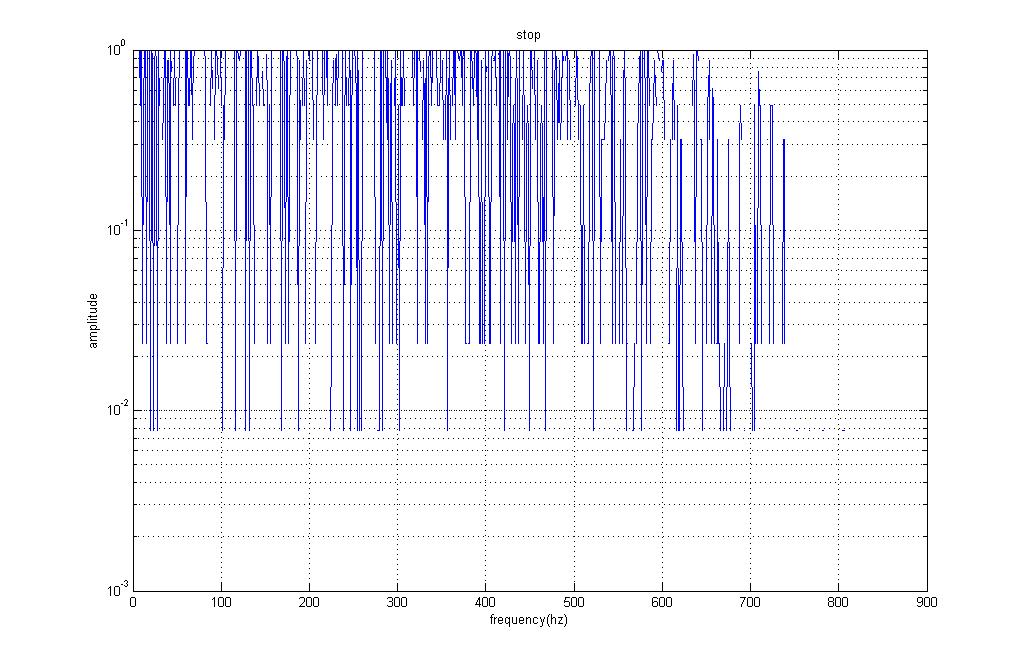
dun know why i got the plot frequency spectrum is symmetry.
tis is my code, can check for me what is my problem

[x fs]=wavread('D:\voice\stop8');
Fs=fs/2;
dt=1/Fs;%% time interval
t=(1:length(x))*dt; %%time vector

X=fft(x);
df=1/(length(x)*dt); %% frequency interval
f=(1:length(X))*df;%% frequency vector

%%
%%% time domain plot, time in seconds
figure
plot(t,x)
xlabel('Time (s)');
ylabel('Amplitude');
grid on

%% frequency domain plot, freq in hertz
figure
semilogy(f,abs(X));
title('stop')
xlabel('frequency(hz)');
ylabel('amplitude');
grid on

%%
figure
semilogy(f,20*log10(abs(X(1:length(x)))+eps));
title('stop')
xlabel('frequency(hz)');
ylabel('amplitude(db)');
legend('fft');
grid on;
 

shift a grid image matlab

If I did really understand what you're talking about is why do you have a symetrical spectral pattern.
That's because the Fourier transform give a symetrical spectral pattern but at zero it means that you should have some negative frequencis. Matlab shift all frequencies untill you have just positive ones. So if you don't like this you just need to use the command "fftshift" instead of "fft" then you'll have a symetrical spectral graph.
If that's not your problem just explain a bit more your problem!
good luck
 

dc component in matlab

75_1163253195.JPG

tis is my frequency, u try to check it out , it's symmetry.

Added after 2 minutes:

i just want the frequency from 0 till 2000hz, so that i can use chebyshev to design the filter.
anyone can help me?
 

fft en guide en matlab

So, as I told you Matlab shifts the negative part of frequency pattern. So you got a symmerical pattern. Just try to use the commande "fftshift" instead "fft" one it's the same syntax you need just to add "shift" to your command. You'll get thus a symetrical curve but with zero as symetry axe.

If you don't want to have the negative part, just limit your curve at 0. try this for exemple

f1=f(1:length(X)/2+1);

for l=1:(length(X)/2+1)
Y(l)=X(l);
end;

Then you try Y instead of X.


Good luck
 

matlab fft frequency vector

i still can't get the frequency.
 

frequency fft matlab

Ok, just try one more time this code
What you really want is that the half of the curve for f=0 to 2000.
if it's not what you want just try to explain more your problem.

[x fs]=wavread('D:\voice\stop8');
Fs=fs/2;
dt=1/Fs;%% time interval
t=(1:length(x))*dt; %%time vector

X=fftshift(x);
df=1/(length(x)*dt); %% frequency interval
f=(1:length(X))*df;%% frequency vector

%%
%%% time domain plot, time in seconds

f1=f(1:length(X)/2+1);

for l=1:(length(X)/2+1)
Y(l)=X(l);
end;

figure
plot(t,x)
xlabel('Time (s)');
ylabel('Amplitude');
grid on

%% frequency domain plot, freq in hertz
figure
semilogy(f1,abs(Y));
title('stop')
xlabel('frequency(hz)');
ylabel('amplitude');
grid on

%%
figure
semilogy(f1,20*log10(abs(Y(1:length(Y)))+eps));
title('stop')
xlabel('frequency(hz)');
ylabel('amplitude(db)');
legend('fft');
grid on;
 

matlab copy fft positive negative

33_1163340872.jpg

i got the this frequency.:|
 

Status
Not open for further replies.

Part and Inventory Search

Welcome to EDABoard.com

Sponsor

Back
Top