Continue to Site

Welcome to EDAboard.com

Welcome to our site! EDAboard.com is an international Electronics Discussion Forum focused on EDA software, circuits, schematics, books, theory, papers, asic, pld, 8051, DSP, Network, RF, Analog Design, PCB, Service Manuals... and a whole lot more! To participate you need to register. Registration is free. Click here to register now.

How to draw Smith Chart in Agilent ADS.

Status
Not open for further replies.

pusparaga

Full Member level 4
Joined
Oct 19, 2013
Messages
197
Helped
4
Reputation
8
Reaction score
4
Trophy points
1,298
Activity points
2,988
Sir,
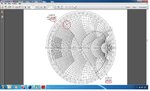
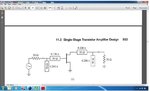
I want to draw the Smith chart in ADS2009. Now, I want to draw David .M. Pozer "microwave engineering" example 11.3 Γs(page #552) and ΓL using Smith chart utility in ADS2009. I know manually, how to draw the Smith Chart ΓS and ΓLbut I don't know how to draw the Smith Chart using Smith chart utility in ADS2009. I am beginner, can you help me anybody to draw ΓS and ΓL for low noise amplifier design.Is there any PDF document help for smith chart drawing , please show me or upload.
 

Attachments

  • POZAR_example11.3_SmithChart.jpg
    POZAR_example11.3_SmithChart.jpg
    908.8 KB · Views: 188

Re: Help need for drawing Smith Chart in Agilent ADS.

In ADS you can plot final return losses S11 or S22 on smith chart ,but not the contour as you do by hand.
To study, you add matching sections one by one and see how marker moves as you go along and moves
towards the center of chart ,the 50 ohm point.
 
Re: Help need for drawing Smith Chart in Agilent ADS.

Sir,
I am not asking the contours to draw, am asking how to draw source reflection coefficient and load reflect coefficient in ADS.
 

Re: Help need for drawing Smith Chart in Agilent ADS.

In ADS schematic,go to s-param template,select any gamma you want to plot
after simulation.
 
Re: Help need for drawing Smith Chart in Agilent ADS.

afz23 Sir,
I didn't understand, what you said. Can you elaborate it in detail and tell me . If possible can you show me in terms of graphical picture.
 

Re: Help need for drawing Smith Chart in Agilent ADS.

jeeudr Sir,
I have gone through, whatever you have shown in the link. That is very useful link, it helps me lot. But I require specifically, input matching and output matching network to draw series and shunt stubs using ADS2009. Manually they have shown , how to draw these things in the Smith chart. But I need to draw using ADS2009 for input matching and output matching network for the low noise amplifier as shown in the posting # 1.

I want to build the input and output matching RF circuit as shown in Pozer example 11.3(Page no : 553) . So I have to draw the input and output matching network, how to draw the ΓS and ΓL using ADS2009. What ever jeeudr shown link, it is not found ΓS and ΓL drawing example. Please any one know , how to draw ΓS and ΓL . If you have graphical help in ADS , please let me know.
 

Attachments

  • Input and Output RF Matching.jpg
    Input and Output RF Matching.jpg
    354.6 KB · Views: 207
Last edited:

Re: Help need for drawing Smith Chart in Agilent ADS.

Yes. It can be done.

First of all, you need to fix the Gamma_S and Gamma_L that you are going to use.

Then, you can insert a smart component / Smith Chart matching utility from ADS toolbox into your schematic. After this, you can either auto-match or use the tool (recommended) to update the component.

See the attachment, especially the figure on second page for an example layout of a simple amplifier with input and output matching networks.
 

Attachments

  • ImpedanceMatchingAmplifier.pdf
    327.9 KB · Views: 198
Re: Help need for drawing Smith Chart in Agilent ADS.

jeedur Sir,
I went through your document, I didn't understand how to select the points for source reflection coefficient and load reflection that is not understood.
 

Re: Help need for drawing Smith Chart in Agilent ADS.

jeedur Sir,
I went through your document, I didn't understand how to select the points for source reflection coefficient and load reflection that is not understood.

Proper selection of Gamma_S and Gamma_L is the crux of LNA design !

For example,
- if you want to optimize noise figure, choose Gamma_S at the center of the smallest noise circle (i.e. Gamma_opt)
- if you want to maximize gain, choose Gamma_S to conjugate match S11

There will be always be trade-off between Gain/NF/IP3/current-draw. It is up to you make the proper choice and justify based on the requirements.

Here is a good article : [https://defenseelectronicsmag.com/s.../files/archive/rfdesign.com/mag/611RFD33.pdf ]
 
Re: Help need for drawing Smith Chart in Agilent ADS.

jeeudr Sir,
What your have showed link(**broken link removed**). If we click on the link,it is showing that page not found. Can you show us to proper link. Even I tried separately in the google search there also it is showing page not found.
 

Re: Help need for drawing Smith Chart in Agilent ADS.

jeeudr Sir,
What your have showed link(**broken link removed**). If we click on the link,it is showing that page not found. Can you show us to proper link. Even I tried separately in the google search there also it is showing page not found.

Try this: **broken link removed**
 
Re: Help need for drawing Smith Chart in Agilent ADS.

Sir,
This one is opening, but LNA description has given in that document, I don't want LNA description. My question is , how to draw the source and load reflection coefficient in the Smith Chart using ADS SMITH CHART ULTILITY.


Is anybody having the PDF document or audio help for Smith chart drawing examples in ADS 2009, please can you upload to us . It will be helpful to who will be looking Smith chart help in ADS.
 
Last edited:

Re: Help need for drawing Smith Chart in Agilent ADS.

I think you need to read the basics properly. Gamma_S and Gamma_L are not properties of the transistor, they are values fixed by the designer.

Given a transistor, there is NO intrinsic value for Gamma_S and and Gamma_L. The transistor can face any value of Gamma_S and Gamma_L. It is up to you to make a choice for what they should be !

In the Pozar example, he has chosen a particular value for the Gamma_S before proceeding with the matching design.

So my first question is do you have a Gamma_S value chosen already ? Because, if not, there is no point in asking how to match Gamma_S to 50 Ohm using Smith chart. I suggest you proceed by plotting the Gain and Noise figure circles to determine the ideal value for Gamma_S.
 
Re: Help need for drawing Smith Chart in Agilent ADS.

Sir,
Yes, I found the values of Gamma_S and Gamma_L. I want to plot these values (Gamma_S and Gamma_L) on the Smith chart to know the length of the open circuited stub and length of the series line.
 

Re: Help need for drawing Smith Chart in Agilent ADS.

The youtube video in my first reply shows the exact procedure that you describe. See the video from 3:45 onwards, where matching is done using transmission lines. It is making use of ADS to draw the Smith Chart and perform the matching. Once you determine the lengths of the two lines, you can insert them in your schematic.

For input side side matching, you need to set load impedance to 50 Ohm and source impedance to your chosen value of Gamma_S.

For output side matching, you set the load impedance to your chosen value of Gamma_L and source impedance to 50 Ohm.

Here is a good tutorial on impedance matching in ADS : https://www.youtube.com/watch?v=lISNOzTFvO4
 
Re: Help need for drawing Smith Chart in Agilent ADS.

Sir,
I understood the matching lumped and transmission line in the you tube video. My question is, from the Scattering parameter of transistor, I found the values of Gamma_S and Gamma_L. Using these Gamma_S and Gamma_L, I need to obtain the series line length and open circuited length.

In the same video, when the series or shunt line is selected, look at the Z0: and Value: boxes located towards the bottom right of the window. The Value denotes the length of the line in degree units. 360 degrees = 1 wavelength. So based on the degree length that you see, you can convert to wavelength terms.

For example, 30 degrees = 30/360 * 1λ = 0.083λ

Untitled.png
 
Re: Help need for drawing Smith Chart in Agilent ADS.

Sir,
I understood, what you said in the previous post. In the Pozer example 11.3(page #552), he has drawn the series line length and open circuited stub length after drawing the Gamma_S. Based on the Gamma_S only, we are able to find out the series line length and open circuited stub length. How to draw the Gamma_S is our difficulty.
 

Re: Help need for drawing Smith Chart in Agilent ADS.

What do you mean by draw Gamma_S ?

In the Smith Chart utility, click on the small circle which denotes source impedance, then set the value in the box to the left corner of the window. This will move the marker to that position.

Untitled.png
 
Status
Not open for further replies.

Part and Inventory Search

Welcome to EDABoard.com

Sponsor

Back
Top