Continue to Site
Follow along with the video below to see how to install our site as a web app on your home screen.
Note: This feature may not be available in some browsers.
Hello
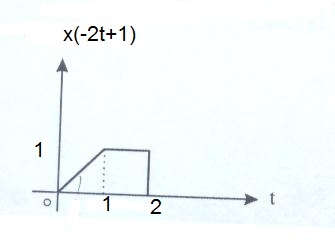
here is the x(-2t+1). i want to know how can find the x(t) diagram from this picture?
")
this is not exactly math this is a representation of a continuous signal mathematically
I think you are a newbie in DSP terminologies the one here is a most common way of representing a signal in te form of math notation that is it
and all the operation are performed on the basic signal which is given by x(t)
Here the x(t) has underwent
a time scaling(2t)
a reflection(-2t)
a delay (-2t+1)
If the above methods are done in the reverse order then the resultant wave front is x(t)
x(t) is not 0 if you are assuming so my pal
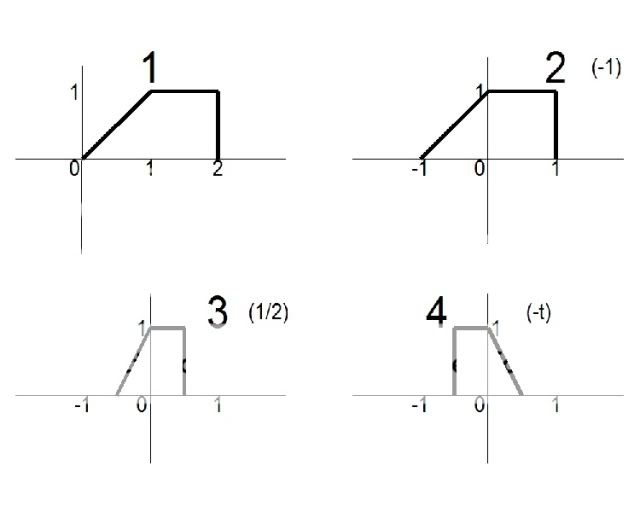

By using 3 steps you can solve the problem:
3) Now shift the complete waveform right for 1/2 period, so the final waveform have the amplitude of 1 and it starts from -1 and ends at 1.
x(t) may represent any signal for e.g. a voltage, current, a sound wave, a television or mobile signal, a video signal which will be played by a pc on a monitor, daily closing of stock market, seismic wave (wave of energy that travel through the Earth), etc..Perhaps I am a "newbie" in this area. That is why I am asking about it. "representing a signal in te form of math notation that is it"? I am sorry, but that makes no sense to me.
Still none of what you are saying has told me what the vertical axis actually represents in the original sketch.