Continue to Site

Welcome to EDAboard.com

Welcome to our site! EDAboard.com is an international Electronics Discussion Forum focused on EDA software, circuits, schematics, books, theory, papers, asic, pld, 8051, DSP, Network, RF, Analog Design, PCB, Service Manuals... and a whole lot more! To participate you need to register. Registration is free. Click here to register now.

Generating Eye diagram

Status
Not open for further replies.

aprilyne

Newbie level 6
Joined
Feb 23, 2012
Messages
14
Helped
0
Reputation
0
Reaction score
0
Trophy points
1,281
Activity points
1,376
hello!

I am having a hard time generating eye diagram for my Tranimpedance amplifier and limiting amplifier.

what should I do to generate eye diagram for my amplifiers?

I'm looking forward for your help.
 

Hi there,

If you are not using cadence I cannot offer you much help. I am sorry.

If you are using cadence it is pretty easy. Let's go step by step:
1. Determine the frequency of the wave. You can do this by special function called freq.
2. As you've determined the frequency, determine the period so that for each period you can fold them together.
3. Use the special function eye diagram and give parameters as calculator results not constants. If you do not do this you may see meaningless patterns at process corners.
A tip: With transient noise eye diagrams offer much more information. One might say that without transient noise they are just performance of corners. The reason of using eye diagrams lies here also: they show you how your system rejects noise, when is the perfect sampling time.

Here, this link contains a fine tutorial for eye diagrams https://www.highfrequencyelectronics.com/Archives/Nov05/HFE1105_Tutorial.pdf
There are many more tutorials, another one is hosted in Agilent's site but unfortunately I couldn't found it by the time I pressed "Post Quick Reply" button. :D
 

kemiyun,

thank you so much for the reply..
i am wondering on how to get the frequency of my wave, suppose I use square wave or pulse as input.
How should i get the frequency? what analysis should I use? is it transient? ac? or dc?

please enlighten me..
 

The frequency is actually important if you are going to do some corner or MonteCarlo analysis. Otherwise I do not think it will make any difference. So the period is just the period of your input wave.

As far as I know best way to get an eye diagram is to run a long transient simulation (With transient noise most probably) with random data inputs (Only clock will also result in eye like shape but without the straight lines on the top and at the bottom.) . Then fold the graphic onto itself with your period or half of your period (Cadence's calculator will do this part for you. Otherwise you might need to export your data and do it yourself.). You will have a graphic looks like an eye.
 

An easy means of "folding" the period is to place a vpwl
source with equal period to the clock, trise=period-3*delta,
tfall=pw=delta (delta being much smaller than period of
interest but greater than min timestep).

Now you can plot that "raster" voltage along with the data
waveform, and change the x-axis to be vt(raster), and
there's your 'scope-like eye diagram. You can change the
vraster delay to center the data eye upon the clock edge.
 
dick freebird,

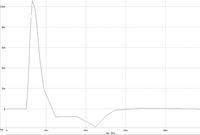
hello, i am using synopsys as tool and whenever I do thew simulation, the output is like this. how do i convert it to eye diagram?
 

First, to generate a useful eye diagram you need to run
multiple cycles. Enough to have some certainty of having
caught all of the variation in time and amplitude.

Then, you have to "fold the time axis" as mentioned, one
way or another (depends on waveform viewer / calculator
options available).
 

Status
Not open for further replies.

Part and Inventory Search

Welcome to EDABoard.com

Sponsor

Back
Top