Continue to Site

Welcome to EDAboard.com

Welcome to our site! EDAboard.com is an international Electronics Discussion Forum focused on EDA software, circuits, schematics, books, theory, papers, asic, pld, 8051, DSP, Network, RF, Analog Design, PCB, Service Manuals... and a whole lot more! To participate you need to register. Registration is free. Click here to register now.

Fabrication of a coupled LC resonance circuit

Status
Not open for further replies.

toyonline

Member level 2
Member level 2
Joined
Jan 17, 2014
Messages
46
Helped
0
Reputation
0
Reaction score
0
Trophy points
6
Visit site
Activity points
457
Hi, I am working on fabrication of a coupled LC resonance circuit. It is like in attachment. From simulation, I know there are two resonant frequencies f1 and f2. Change capacitor C3 will give different ratio of f1:f2. From the simulation, I know as C3 approaches to 78 pFarad, the ratio is approaching 1:2, which is what I want.

But still I have some problems. How could I figure out a physical explanation of the existance of double frequencies in this coupled LC resonance circuit? Is it any qualitative way to 'predict' those two frequencies? Or at least a explanation of tendency of the ratio change under different capacitance and inductance.

The only thing I could understand is, if C3 approaches infinity, then C3 will behave like a open part, which will change the overall circuit as if C3 is not exist. Then the circuit could be understand as a simple series LC circuit, which possessing a single frequency. Am I right?

Would you please help me to understand such a circuit physically? Thank you guys:smile:

- - - Updated - - -

Here is the attached circuit.
coupled LC circuit.PNG
Hi, I am working on fabrication of a coupled LC resonance circuit. It is like in attachment. From simulation, I know there are two resonant frequencies f1 and f2. Change capacitor C3 will give different ratio of f1:f2. From the simulation, I know as C3 approaches to 78 pFarad, the ratio is approaching 1:2, which is what I want.

But still I have some problems. How could I figure out a physical explanation of the existance of double frequencies in this coupled LC resonance circuit? Is it any qualitative way to 'predict' those two frequencies? Or at least a explanation of tendency of the ratio change under different capacitance and inductance.

The only thing I could understand is, if C3 approaches infinity, then C3 will behave like a open part, which will change the overall circuit as if C3 is not exist. Then the circuit could be understand as a simple series LC circuit, which possessing a single frequency. Am I right?

Would you please help me to understand such a circuit physically? Thank you guys:smile:
 

Attachments

  • coupled LC circuit.PNG
    coupled LC circuit.PNG
    13.2 KB · Views: 84

How could I figure out a physical explanation of the existance of double frequencies in this coupled LC resonance circuit?

There are three resonating loops in your schematic.

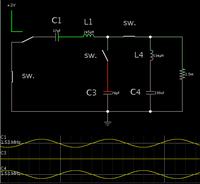
An animated interactive simulator is ideal for observing a circuit such as this.

Here it is laid out in Falstad's (available free to download and use at www.falstad.com/circuit).


Click the link below to open the falstad.com website, load my schematic into his simulator, and run it on your computer.

https://tinyurl.com/mnt6cnp

One switch connects a DC supply. Close this momentarily to instigate oscillations. These will continue for a while since they are practically undamped.

Open and close the other switches, to see how the three resonating loops act, together and individually.

You can watch the electrons (excuse me... rather, current bundles) oscillate back and forth through the wires.

The frequencies are displayed at left of the scope traces.
 

When C3 approaches infinity (high capacitance) it becomes a short , not open.
I think there is quite a few things happening in this cct. There will be a series resonance of C1 L1 at about 1.5MHz.
There is the parallel resonance of C3 L4 at about 1.88MHz. There are 2 other peaks at 1.2Mhz and 2.3Mhz which are probably
from combinations of these components. C4 can be ignored for higher frequencies(over say 100khz).
Do an AC analysis with the circuit you have. Measuring across R1 you will get the 2 peaks at 1.2 ans 2.3.
Do a measurement across C1 and L1 and you will see the other peaks. Attached is the second option.
I'm sure some rf guru's can chip in here and give a better explanation.
 

Attachments

  • ltspice cap.jpg
    ltspice cap.jpg
    133.2 KB · Views: 76

Thanks neddie. I have obtained AC analysis of the circuitAC analysis.PNG. What I observed is attached. I have two point here:

1. could these 4 peaks be explained as: 2 due to a series and a parallel LC, additional 2 due to the combination? If yes, why the combination will produce 2 new frequency rather than other numbers? Is it related to some linear algebra?

2. if I have two series LC plus one parallel LC, do this circuit give me 3 basic frequencies, plus some number of combination frequencies? I have slightly modified that circuitmodified LC circuit.PNG, but to my surprise, there are still 4 frequenciesAC analysis of modified LC.PNG. I am confused here. Would you give me more suggestions? Thanks.

When C3 approaches infinity (high capacitance) it becomes a short , not open.
I think there is quite a few things happening in this cct. There will be a series resonance of C1 L1 at about 1.5MHz.
There is the parallel resonance of C3 L4 at about 1.88MHz. There are 2 other peaks at 1.2Mhz and 2.3Mhz which are probably
from combinations of these components. C4 can be ignored for higher frequencies(over say 100khz).
Do an AC analysis with the circuit you have. Measuring across R1 you will get the 2 peaks at 1.2 ans 2.3.
Do a measurement across C1 and L1 and you will see the other peaks. Attached is the second option.
I'm sure some rf guru's can chip in here and give a better explanation.

- - - Updated - - -

Hi BradtheRad, that's a really nice demonstration of circuit, thank you.

I have some insights from your demonstration.

It seems to me, the existence of two frequencies f1 and f2 at R1 could be understand from two oscillation modes of the circuit. These modes is somehow related to 'normal mode oscillation'. So in order to qualitatively predict how many frequencies are there, I need to find out how many such kind of oscillation in the circuit. A simple draw of possible 'normal mode oscillation' will tell me that. This argument seems to hold for my circuit.

But one more problem is, if I increase possible loops in the circuit, intuitively a corresponding oscillation mode, that will give more resonant freq. But actually, I failed to do that to modify my circuit.

Does this mean a simple understanding of possible resonant freq in LC circuit is in vague? I am happy to wait for further discussion. Thanks.


There are three resonating loops in your schematic.

An animated interactive simulator is ideal for observing a circuit such as this.

Here it is laid out in Falstad's (available free to download and use at www.falstad.com/circuit).


Click the link below to open the falstad.com website, load my schematic into his simulator, and run it on your computer.

https://tinyurl.com/mnt6cnp

One switch connects a DC supply. Close this momentarily to instigate oscillations. These will continue for a while since they are practically undamped.

Open and close the other switches, to see how the three resonating loops act, together and individually.

You can watch the electrons (excuse me... rather, current bundles) oscillate back and forth through the wires.

The frequencies are displayed at left of the scope traces.
 

Thanks neddie

When C3 approaches infinity (high capacitance) it becomes a short , not open.
I think there is quite a few things happening in this cct. There will be a series resonance of C1 L1 at about 1.5MHz.
There is the parallel resonance of C3 L4 at about 1.88MHz. There are 2 other peaks at 1.2Mhz and 2.3Mhz which are probably
from combinations of these components. C4 can be ignored for higher frequencies(over say 100khz).
Do an AC analysis with the circuit you have. Measuring across R1 you will get the 2 peaks at 1.2 ans 2.3.
Do a measurement across C1 and L1 and you will see the other peaks. Attached is the second option.
I'm sure some rf guru's can chip in here and give a better explanation.

- - - Updated - - -

Thanks neddie

I find the post message is delayed, and some of the information are disappear. I have lost my attached pictures. Sorry for that. I will try to upload again.
 

Status
Not open for further replies.

Similar threads

Part and Inventory Search

Welcome to EDABoard.com

Sponsor

Back
Top