Continue to Site

Welcome to EDAboard.com

Welcome to our site! EDAboard.com is an international Electronics Discussion Forum focused on EDA software, circuits, schematics, books, theory, papers, asic, pld, 8051, DSP, Network, RF, Analog Design, PCB, Service Manuals... and a whole lot more! To participate you need to register. Registration is free. Click here to register now.

detect zero crossing using matlab coding

Status
Not open for further replies.

Eng.Salwa1

Newbie level 4
Joined
Feb 6, 2016
Messages
7
Helped
0
Reputation
0
Reaction score
0
Trophy points
1
Activity points
71
Hello there
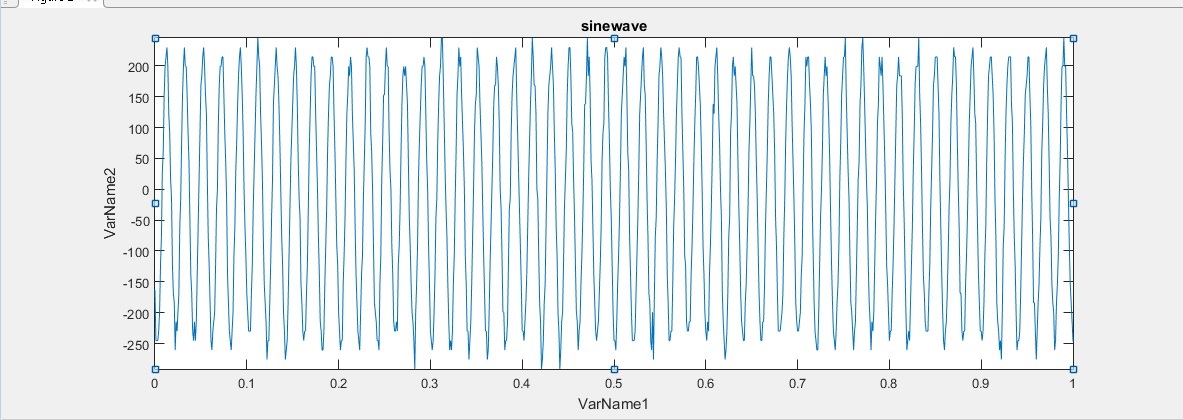
I am trying to write a code to detect the zero crossing in a sine wave using matlab
i have obtained the signal from an oscilloscope in xlsx file
it contains voltage against time ( two columns and 10000 rows)
I want to detect & plot the zero crossing of the signal
Please have a look at my waveform
4939206300_1454799724.jpg
 

The only thing that comes to mind is to take the rolling average of a large number of cycles, let's say n, and compare this result with the current value to check if it is above or below. Considering that the waveform has an amplitude varying along many cycles, you have to make some experiments to determine the smaller value for n which satisfy the need.
 

Hi,

Usually a compare with 0... then you get a square wave...
And if you just want the edges, then simple say: "if the value before is not the actual value"

To simplify..without square wave
You could just keep an eye on the sign bit of the input signal: "if the value before is not the actual value"

Klaus
 

You could just keep an eye on the sign bit of the input signal: "if the value before is not the actual value"

Yes, that is called Bolzano's Theorem. Keep an eye on the sign and then just make that interval as small as you can.
 
Status
Not open for further replies.

Part and Inventory Search

Welcome to EDABoard.com

Sponsor

Back
Top