Continue to Site

Welcome to EDAboard.com

Welcome to our site! EDAboard.com is an international Electronics Discussion Forum focused on EDA software, circuits, schematics, books, theory, papers, asic, pld, 8051, DSP, Network, RF, Analog Design, PCB, Service Manuals... and a whole lot more! To participate you need to register. Registration is free. Click here to register now.

Correct measurement of process variations

Status
Not open for further replies.

allennlowaton

Full Member level 5
Full Member level 5
Joined
Oct 5, 2009
Messages
247
Helped
3
Reputation
6
Reaction score
3
Trophy points
1,298
Location
Taiwan
Activity points
3,055
Good day Sirs/Maams,
Hope you are all doing good.

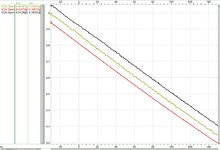
Shown below are the TT,FF and SS graphs (top to bottom).
I am confused on how to properly measure the process variation of this one.
Do I need to include into consideration the range of the y-axis?

By the way, these are the TTFFSS corner graphs versus temperature (x-axis).

Thank you.
 

Attachments

  • Tin_Tref over dT_TTFFSS corners.jpg
    Tin_Tref over dT_TTFFSS corners.jpg
    143.2 KB · Views: 59

dick_freebird

Advanced Member level 7
Joined
Mar 4, 2008
Messages
8,359
Helped
2,309
Reputation
4,628
Reaction score
2,368
Trophy points
1,393
Location
USA
Activity points
66,825
First realize that "corner" models are a pretty weak cartoon,
of true process / device variability. These corners serve to
support timing / drive strength models and little else. They
are wholly inadequate to analog interests and embed
assumptions about correlation of detail params (for
example VTN and VTP, u0n and u0p are co-variant in these
models when in fact there's no such process correlation
(toxn and toxp, there's only one tox for a given voltage
rating family of FETs).

Since it's all a cartoon I don't know what you'd try to figure
out from it - or whether you'd be smart to believe it.
 

allennlowaton

Full Member level 5
Full Member level 5
Joined
Oct 5, 2009
Messages
247
Helped
3
Reputation
6
Reaction score
3
Trophy points
1,298
Location
Taiwan
Activity points
3,055
First realize that "corner" models are a pretty weak cartoon,
of true process / device variability. These corners serve to
support timing / drive strength models and little else. They
are wholly inadequate to analog interests and embed
assumptions about correlation of detail params (for
example VTN and VTP, u0n and u0p are co-variant in these
models when in fact there's no such process correlation
(toxn and toxp, there's only one tox for a given voltage
rating family of FETs).

Since it's all a cartoon I don't know what you'd try to figure
out from it - or whether you'd be smart to believe it.
I did not totally understand what do you mean. On this graph, my initial idea to compute for process corner variations (TT to FF, TT to SS) is just to get the specific value at room temperature then proceed to (FF value - TT value) / TT value. However, I am perplexed if I will also include the value of the range at the Y-axis (max at 9 - min at 8.2).
 

AMS012

Full Member level 4
Full Member level 4
Joined
Oct 29, 2012
Messages
232
Helped
48
Reputation
98
Reaction score
59
Trophy points
1,308
Location
India
Activity points
2,761
If you want to just quote the process variation, do it at a particular temperature (may be the worst case). That's it.
 
Status
Not open for further replies.

Similar threads

Part and Inventory Search

Welcome to EDABoard.com

Sponsor

Top