Continue to Site

Welcome to EDAboard.com

Welcome to our site! EDAboard.com is an international Electronics Discussion Forum focused on EDA software, circuits, schematics, books, theory, papers, asic, pld, 8051, DSP, Network, RF, Analog Design, PCB, Service Manuals... and a whole lot more! To participate you need to register. Registration is free. Click here to register now.

Cadence simulation - Voltage Vs Gain plot

Status
Not open for further replies.

shaikss

Full Member level 4
Joined
Jun 18, 2007
Messages
229
Helped
1
Reputation
2
Reaction score
1
Trophy points
1,298
Activity points
3,319
Hi All,

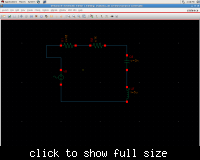
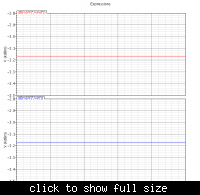
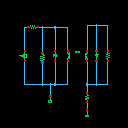
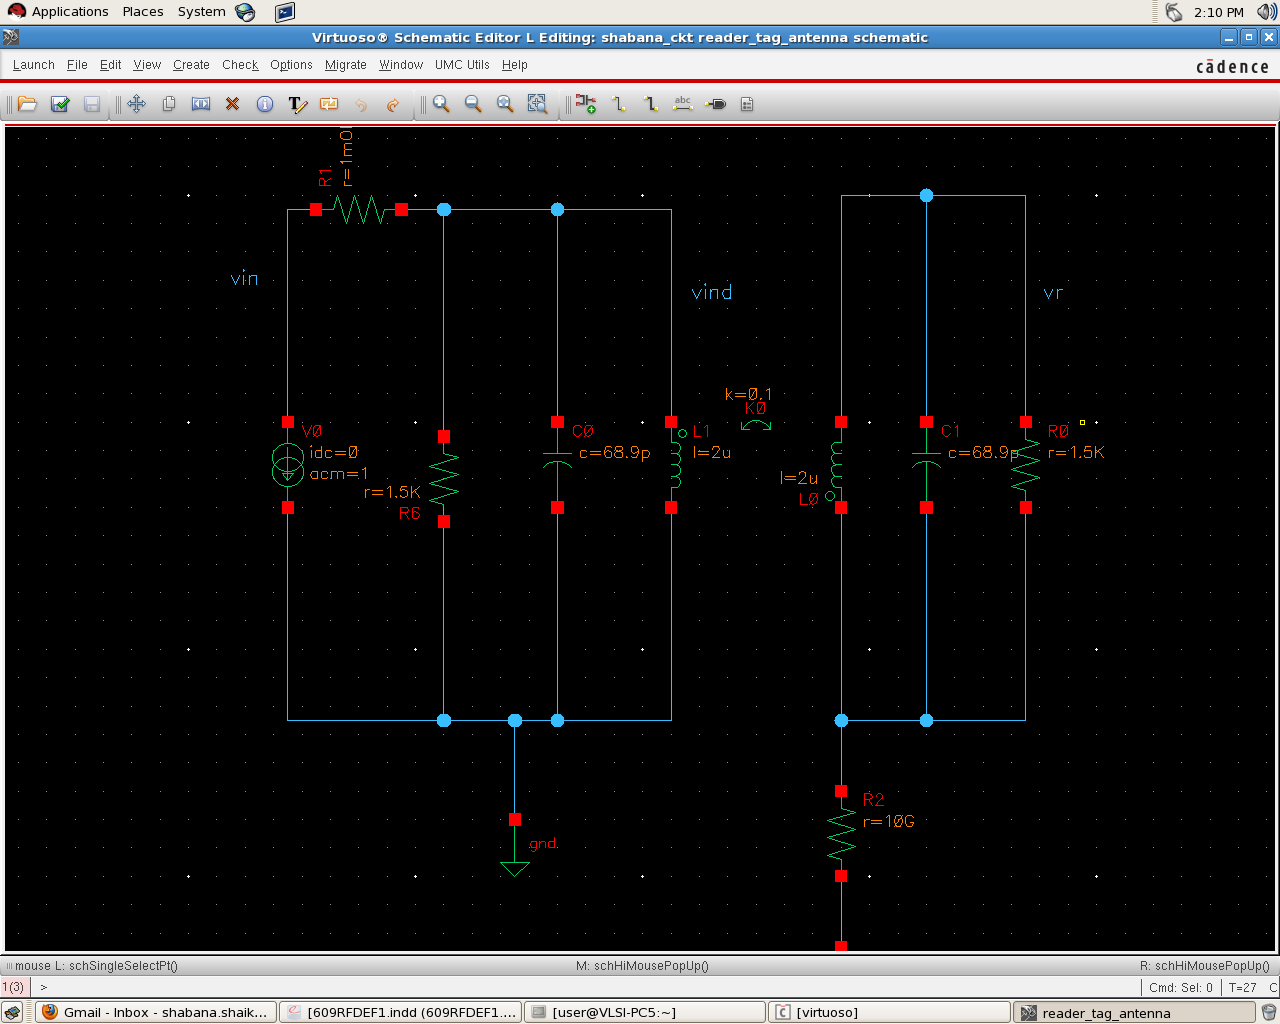
Attached is the schematic of the circuit and plot of voltage at Inductor Vs Frequency.

I want to plot the Vol across inductor (L1) Vs Freq.

This is the process I have followed:

1. Go to analyses -> Select ac
2. Set the start and stop freq sweep as 0 to 50MHz.
3. Go to Output -> Select calculate. It will take to another window -> Select Vf for ac -> select the net of the inductor L1.
4. Click on Get Expression of the Output. Add the exp to the output window.
5. Click the "Netlist and then Plot" icon.

I expected the output as the resonant circuit output, which has its maximum at 13.56MHz.
But unfortunately, the resultant plot is shown in as attachement.
Can you please the reason for this abnormal behavior?
Correct me if I am wrong at any of the steps.

47_1315384336.png


Thanks,
Shabana
 

Your schematic in not really evident...please re-upload!


I have uploaded the image again

---------- Post added at 10:23 ---------- Previous post was at 10:04 ----------

Your schematic in not really evident...please re-upload!

I have uploaded the schematic again
 

Well,i have to remarks :

1.)In the plot you provided at your first post the y-axis is in dBm.
dBm unit is used for power measurements and not for voltage measurements.Nevertheless,you can easily convert it in Volts (rms or peak) if you are given a characteristic resistanse :

P=(Vrms)²/R

and P(dBm)=10*log(P/1mW) , where P is expressed in mW.

Combine those two equations and you can deduce the Vrms.

2.)Substitute the ac current source with a vsin source from analog lib with (acm=1) and then run ac analysis.Go back to the calculator as you did and plot the VF you are interested in.
 
Last edited:
Well,i have to remarks :

1.)In the plot you provided at your first post the y-axis is in dBm.
dBm unit is used for power measurements and not for voltage measurements.Nevertheless,you can easily convert it in Volts (rms or peak) if you are given a characteristic resistanse :

P=(Vrms)²/R

and P(dBm)=10*log(P/1mW) , where P is expressed in mW.

Combine those two equations and you can deduce the Vrms.

2.)Substitute the ac current source with a vsin source from analog lib with (acm=1) and then run ac analysis.Go back to the calculator as you did and plot the VF you are interested in.


I have run the simulation as you suggested and attached is the plot.
The attached plot shows unity from 1MHz to 20MHz.
If you consider the first part of the circuit, it is a resonant circuit.
If the expectation is to see the resonant frequency of the circuit, what should I plot?
Please let me know.snapshot.png
 

Your voltage source has a really small resistance (R1 =1mOhm ?), so that vind=vin.
 

Your voltage source has a really small resistance (R1 =1mOhm ?), so that vind=vin.

I tried to draw plot between current and frequency. I selected If in the calculate menu. When I tried to select the net from the schematic, I am getting this error.

*Warning* object selected is not a valid selection object

I have given Vsin as input. 1KHz is the frequency and ac magnitude is 2V.
Pls correct me where I am wrong. I am newbie to Cadence Spectre.


-Thanks!
 

If i remember well you must hit on a node of a source or other device to plot current and not a net.Give it a try.
 
I have given Vsin as input. 1KHz is the frequency and ac magnitude is 2V.
Pls correct me where I am wrong. I am newbie to Cadence Spectre.


This sounds as you are going to command a TRAN analysis (because of 1 kHz).
For ac analysis you specify just an ac magnitude - that`s all!
And watch your frequency resolution. Your results as presented earlier look rather strange (because of the "edge" at left) .
 

If i remember well you must hit on a node of a source or other device to plot current and not a net.Give it a try.

Its not working jimito.

I want to check the current Vs frequency plot.
Is there any other way to check the frequency response of the circuit? On a high level, by seeing a plot, one has to know that the circuit resonates at "x" frequency. This is my intention.


Thanks!
 

shaikss, why don`t you tell us about your input signal specification and the analysis used?
 
shaikss, why don`t you tell us about your input signal specification and the analysis used?

Input Signal : Vsin : ac magnitude 2V, frequency :1kHz.
Analysis : AC analysis.
 

I want to check the current Vs frequency plot.

If you can't get current measurement to work, insert a small resistor and measure the voltage across the resistor. :roll:

Or increase the value of R1, so that the voltage across the resonator can change.
 

Input Signal : Vsin : ac magnitude 2V, frequency :1kHz.
Analysis : AC analysis.

Did you read my reply #9 ?
Why do you select 1 kHz in spite of an ac analysis? That`s a contradiction!
 
If i remember well you must hit on a node of a source or other device to plot current and not a net.Give it a try.

Thanks jimito!! Your suggestion really worked well :)
I didn't get the desired output but progressing slowly

---------- Post added at 09:46 ---------- Previous post was at 09:44 ----------

Did you read my reply #9 ?
Why do you select 1 kHz in spite of an ac analysis? That`s a contradiction!

Hi LvW,

I did in this manner.
Initially I selected Vsin from analoglib. Upon hitting q, I modified the parameters as frequency = 1KHz and ac magnitude as 2v.
Once I did Save and check. I opened the Spectre.
There in the analysis, I selected "ac analysis".
Am I wrong in any of the steps?
Pls let me know how to proceed?
Is it like that in ac analysis you don't need to specify the freq of the input signal? Why so?
 

Fon an AC analysis you only need to specify the ac magnitude and nothing else.From the setup of the analysis you specify the frequency sweep.

For a transient analysis you inject the specific frequency of interest and simulate.Be ware that for a transient analysis you must use amplitude and NOT ac magnitude.

Thanks jimito.

I just experimented a series resonator circuit which resonates at 156KHz.
I have added 10ohm series resistance to the voltage source.
I have given acm of 2v and nothing else.

I want to plot a graph which shows current vs freq and shows the peak at the resonant frequency.
So, how should I plot the same?
Attached is the schematic.
url=http://obrazki.elektroda.pl/38_1315472731.png]
38_1315472731_thumb.png
[/url]

---------- Post added at 11:11 ---------- Previous post was at 10:05 ----------

url=http://obrazki.elektroda.pl/38_1315472731.png]
38_1315472731_thumb.png
[/url]

I expected this kind of plot but I am not getting behaviour like that.
Not getting where the error is.
Pls help me
 

I think we already answered this question...Run ac analysis and plot the current at a node.
I can't understand if you have an implying question that is not evident...

A remark : Your last image lacks of the GND/VSS node.Add a gnd component from analog lib and connect it to the (-) node of your source and to the bottom node of your inductor.
 
Status
Not open for further replies.

Part and Inventory Search

Welcome to EDABoard.com

Sponsor

Back
Top