shaikss
Full Member level 4
Hi,
In what scenarios active inductor behaves like a resistor?
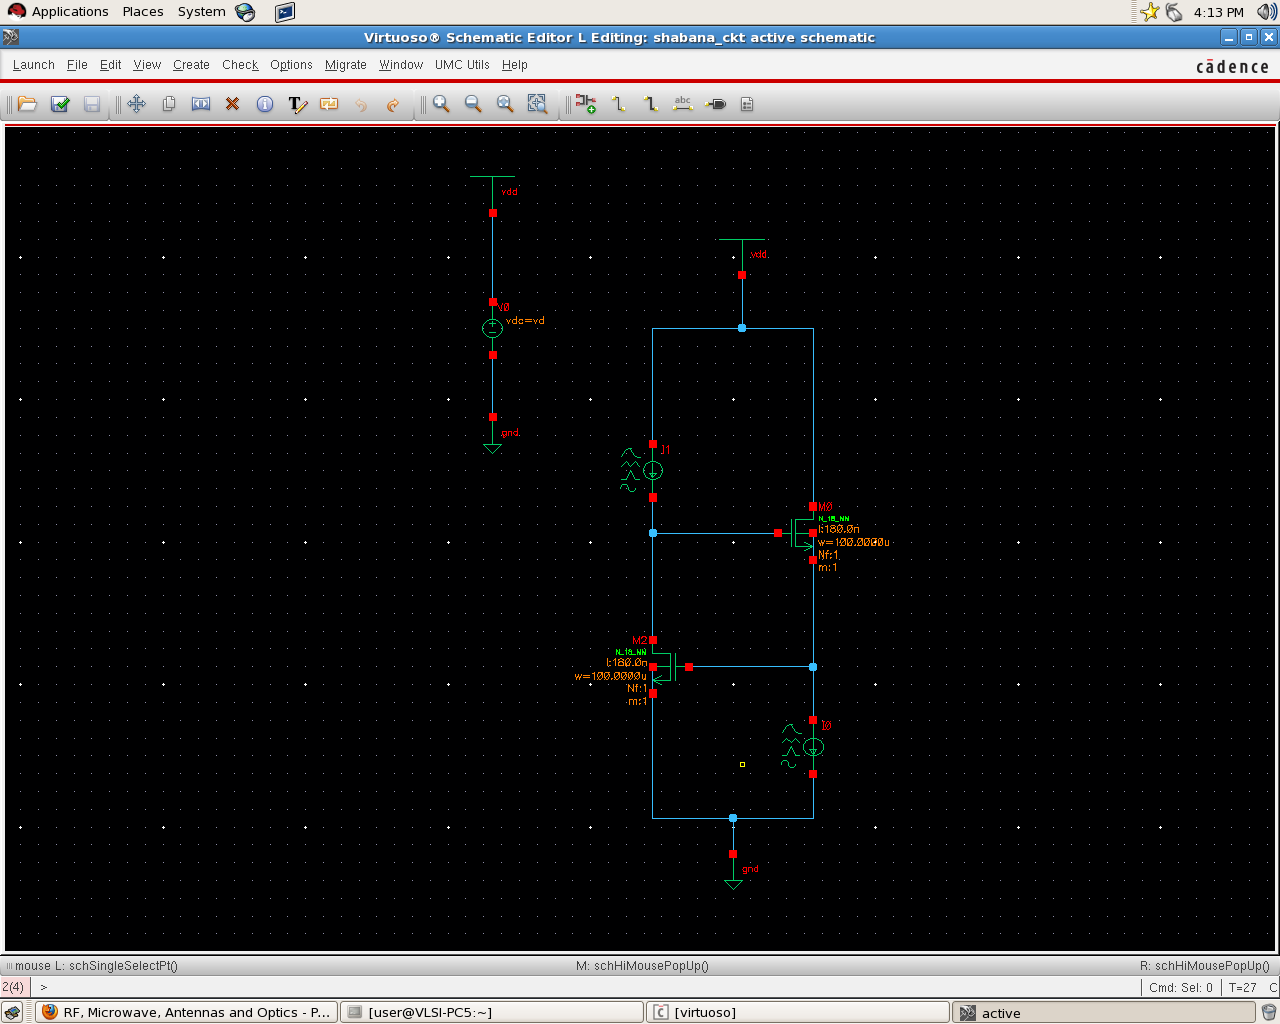
I simulated a grounded active inductor circuit by setting the current values I1 = 1u and I0 = 1mA
I sweeped Vdd from 0 to 1.8V.
When I plotted the graph between Impedence seen from M0 and Vdd, I can see only the real part and the imaginary part is zero.
I don't understand why it is behaving so.
M0 is in Saturation region when Vdd is greater than or equal to 4mv and M2 is in Subthreshold region for the entire Vdd range.
Please help me to make the inductor to work with imaginary part of the impedence.
What are the changes required to do in order to see the effect?
Thanks
PS: I have set Vdd as 1.8V and varied i1 and i2 to check the operating regions of the MOS's. When I did so, I observed the below things:
1u <= I1 <= 390u M1 is in Subthreshold
1u <= I1 <= 500u M2 is in Saturation
100u <= I2 <= 1mA M1is in Subthreshold and M2 is in Sat region.
By checking these values, I have set I1 as 350uA and I2 as 600uA.
My intention is to plot real and imaginary part of impedence Vs transconductance.
How to proceed further?
Thanks
In what scenarios active inductor behaves like a resistor?
I simulated a grounded active inductor circuit by setting the current values I1 = 1u and I0 = 1mA
I sweeped Vdd from 0 to 1.8V.
When I plotted the graph between Impedence seen from M0 and Vdd, I can see only the real part and the imaginary part is zero.
I don't understand why it is behaving so.
M0 is in Saturation region when Vdd is greater than or equal to 4mv and M2 is in Subthreshold region for the entire Vdd range.
Please help me to make the inductor to work with imaginary part of the impedence.
What are the changes required to do in order to see the effect?
Thanks
PS: I have set Vdd as 1.8V and varied i1 and i2 to check the operating regions of the MOS's. When I did so, I observed the below things:
1u <= I1 <= 390u M1 is in Subthreshold
1u <= I1 <= 500u M2 is in Saturation
100u <= I2 <= 1mA M1is in Subthreshold and M2 is in Sat region.
By checking these values, I have set I1 as 350uA and I2 as 600uA.
My intention is to plot real and imaginary part of impedence Vs transconductance.
How to proceed further?
Thanks
Last edited: