Amir.Sk
Newbie level 6

Hi
I want to plot simple array of data in ADS smith Chart ( On display page , I\m not talking about ADS smith Chart utility).
Consider my load to be an array :
loads= [ 0.1::0.1::3]
My desired chart which is presented in one of keysight's tutorials must be like :

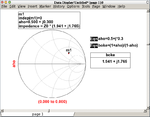
But I get this:

I know that I'm missing an important concept including normalizing and characteristic Impedance.
Thanks for your time!
I want to plot simple array of data in ADS smith Chart ( On display page , I\m not talking about ADS smith Chart utility).
Consider my load to be an array :
loads= [ 0.1::0.1::3]
My desired chart which is presented in one of keysight's tutorials must be like :
But I get this:
I know that I'm missing an important concept including normalizing and characteristic Impedance.
Thanks for your time!


")