:-)
Junior Member level 1
- Joined
- May 31, 2012
- Messages
- 15
- Helped
- 0
- Reputation
- 0
- Reaction score
- 0
- Trophy points
- 1,281
- Location
- Wonder Land Called India
- Activity points
- 1,385
Hi,
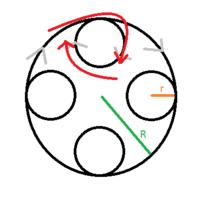
I need to plot the above curve in Matlab. The curve is formed by a big circle (radius R) small circle (radius r). Direction followed by a curve is indicated by red arrow. I wish to have a governing parametric equation for this curve, so that it would be easy for me to plot and experiment further.. Looking for your kind help and suggestions...
Thanks in advance.
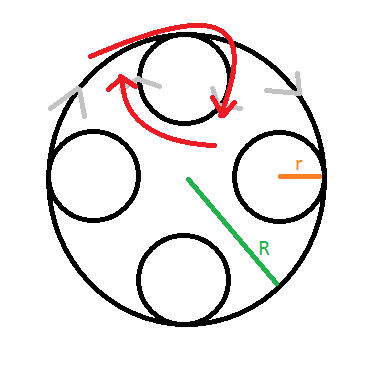
Last edited: