Continue to Site

Welcome to EDAboard.com

Welcome to our site! EDAboard.com is an international Electronics Discussion Forum focused on EDA software, circuits, schematics, books, theory, papers, asic, pld, 8051, DSP, Network, RF, Analog Design, PCB, Service Manuals... and a whole lot more! To participate you need to register. Registration is free. Click here to register now.

Common results from superposition of dependent sources/feedback diagrams

Status
Not open for further replies.

thutch

Junior Member level 1
Joined
Dec 1, 2010
Messages
16
Helped
3
Reputation
6
Reaction score
3
Trophy points
1,283
Activity points
1,390
Hey all,
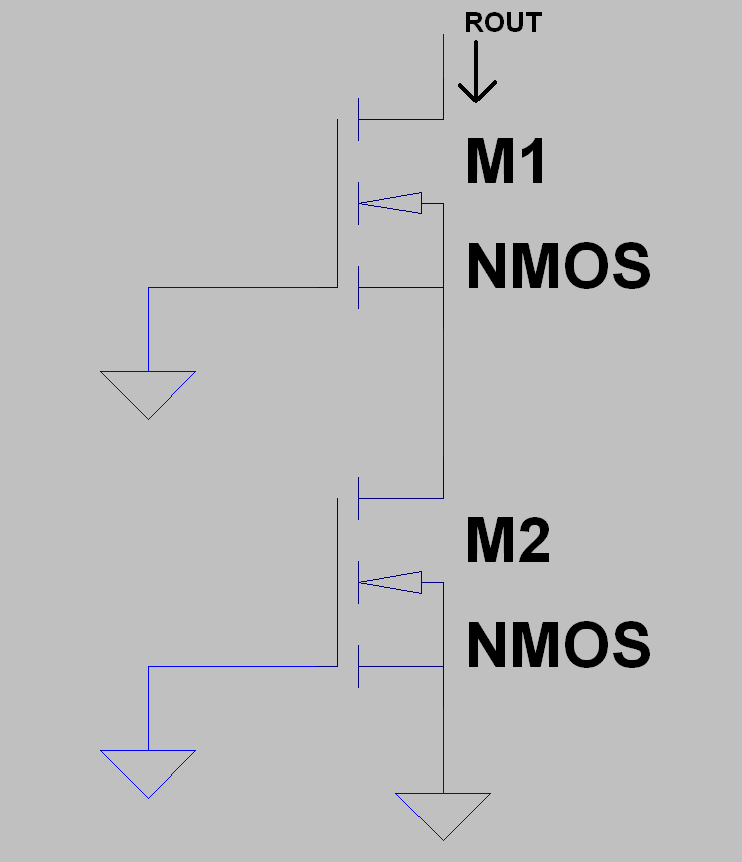
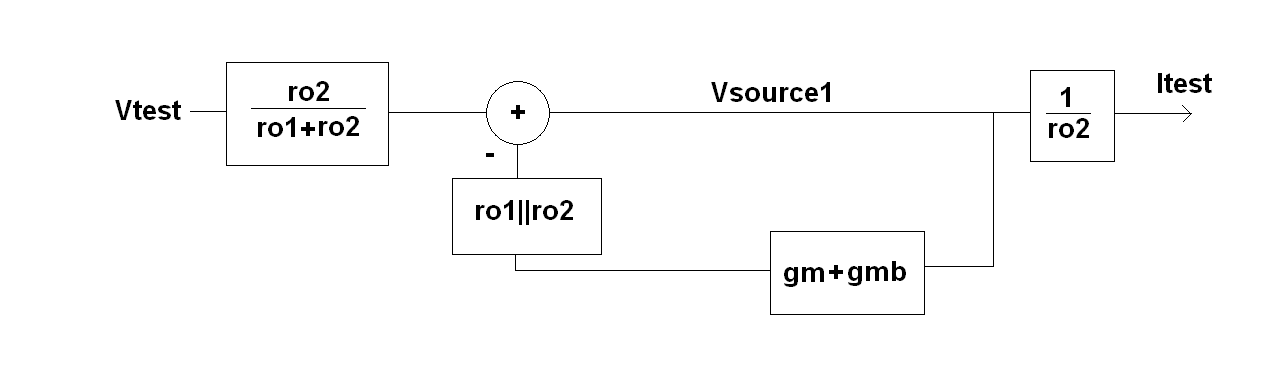
So, I think this is probably one of the neatest analysis tools I've seen. Using superposition of dependent sources and drawing a feedback diagram, producing some common results. I've seen it used to determine the output resistance of a source degenerated FET/cascode which I included some simple diagrams for to see. Basically, if you simplify the feedback diagram using Black's formula you get output resistance of a cascode (ro1+ro2+(gm1+gmb1)ro1ro2). Has anyone seen any other particularly insightful uses of this method? I feel like it gives a lot more insight, but maybe I'm just a sucker for block diagrams.


Hi thutch,

I agree with you - it's a nice representation of the circuit and it gives a lot more insight in the feedback principle.
Such a block diagram representation is very useful - in particular, if the feedback loop can not be identified via visual inspection. More than that, it is the best method to derive an expression for the loop gain.
It's easy to produce a similar arrangement also for the simple case of a BJT with emitter degeneration.
In principle, such a block diagram is nothing else than a graphical representation of the corresponding formulas describing the voltage-current relationship within the circuit.
 
  • Like
Reactions: thutch

    thutch

    Points: 2
    Helpful Answer Positive Rating
Hello.

This kinds of graphs are also well known as signal flow graphs.
There is an unified methodology to systematically build and analysis such graphs (driving-point impedance approach and Mason's gain formula).
I personally frequently use this method for analysis of some circuitries.

If you are interested in I can refer you to:
A systematic approach to the analysis of general and feedback circuits and systems using signal flow graphs and driving-point impedance
Ochoa, A., Jr.;
Circuits and Systems II: Analog and Digital Signal Processing, IEEE Transactions on
Volume: 45 , Issue: 2

Analysis of the modified MOS Wilson current mirror: a pedagogical exercise in signal flow graphs, Mason's gain rule, and driving-point impedance techniques
Spencer, R.G.;
Education, IEEE Transactions on
Volume: 44 , Issue: 4
 
  • Like
Reactions: thutch

    thutch

    Points: 2
    Helpful Answer Positive Rating
Thanks for the papers DenisMark, this is exactly what sort of suggestions I was hoping for from this post! Looking forward to reading the papers.

Applying "signal flow graphs" to common oscillator topologies would be especially neat.
Thanks!
 

Status
Not open for further replies.

Similar threads

Part and Inventory Search

Welcome to EDABoard.com

Sponsor

Back
Top