Continue to Site

Welcome to EDAboard.com

Welcome to our site! EDAboard.com is an international Electronics Discussion Forum focused on EDA software, circuits, schematics, books, theory, papers, asic, pld, 8051, DSP, Network, RF, Analog Design, PCB, Service Manuals... and a whole lot more! To participate you need to register. Registration is free. Click here to register now.

why s11 figure shows teo resonance frequency?

Status
Not open for further replies.

ghasem_008

Full Member level 4
Joined
Feb 9, 2012
Messages
221
Helped
11
Reputation
22
Reaction score
10
Trophy points
1,298
Activity points
2,990
hi.
Happy new year...
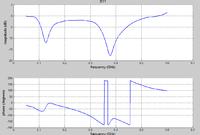
I have a question.I simulated a monopole antenna by 3d FDTD (in VHF band) and obtained S11 figure for it.
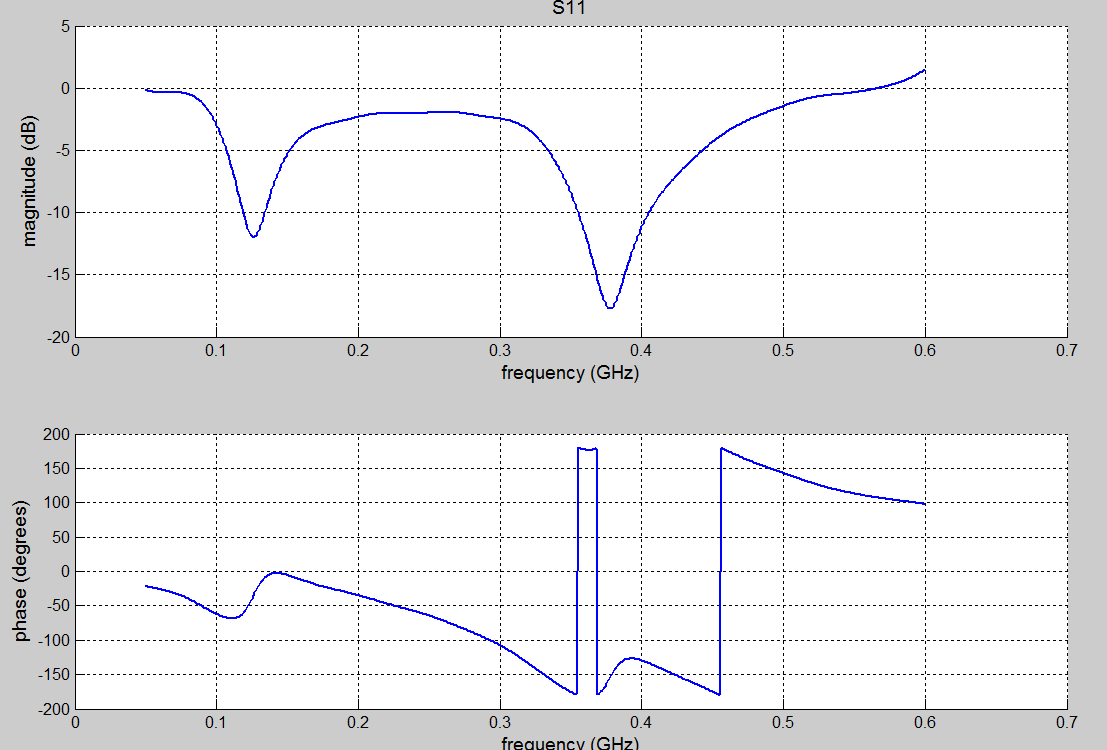
but my s11 figure shows two resonant points.one of them is same as 3e8/4*(antenna length).but the other point is 200 MHz away from first point.why I have two resonance frequency?
which of them is true?my monopole antenna lenght is L=50 cm.
I have another question.why s11 phase figure is not regular?(for example ramp waveform)
thanks...
I attached s11 figure:

please help me...
 

S11 reflects the fact that how much reflection back is there ... from the graph the two points that you talked show that impedance there is better matched than other points at that particular frequency !!
 

what is the method for modelling the thin wire? the method that you use to model thin wire can be affected on your results. I think in the numerical method you should check your result with commercial software such as CST/HFSS/XFDTD. are you sure the numerical results is true?
 

hi,thanks for your attention.
my antenna is not a metal antenna,it is dielectric antenna.so I didn't use from thin-wire modeling.aslo,for source,I used from voltgae source with internal resistance between ground plane and and a metal sleeve sorrounded my antenna.
when I changed excitation and used thin-wire for probe of feed coax,I received only a resonant frequency in s11 figure.so you say that,this error(two minimum at s11 figure) is due to false excitation source?
 

Yes, It is possible, but I think you need a commercial software or any other technique to verify your results.
good luck
 

Hi. I know this is late but this is the explanation for your resonance frequencies. From theory, the first resonant mode will be λ/4 wavelength frequency. The second mode will be one and a half standing waves within the monopole length which means there are three λ/4 wavelengths resonating and is three times the first mode. The third mode will be two and a half standing waves within the monopole length which gives five λ/4 wavelengths and is five times the first resonating frequency. So from your graph, your first resonance is about 0.125 GHz, therefore your second and third resonances will be at 0.375GHz and 0.625 GHz respectively. Looking at your graph, this is accurate, however i'm not sure as to what happened to the third resonance.
 

thank you very much for your attention ok1987.
so,this is not due to false excitation?I thought that this occurs to higher order modes due to discontinuity in voltage source location.becuase I applied voltage source in edge of distance of between GND plane and upper arm of antenna.
 

Status
Not open for further replies.

Part and Inventory Search

Welcome to EDABoard.com

Sponsor

Back
Top