jayeffe
Junior Member level 2
Hi everyone I'm working with a Quartus II signal tap and I have a problem.
Given that I know how to export the data from the signal tap, I need to process them in matlab.
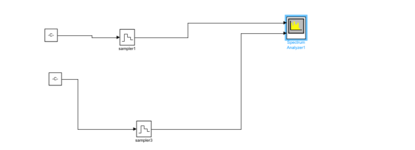
I created a signal called ADC_DB and another ADC_DB_filter.
These two signals represent a filtered and unfiltered signal by fir filter.
I tried filtering through HW and found that the filter works. But I have to try to do the same thing through matlab.
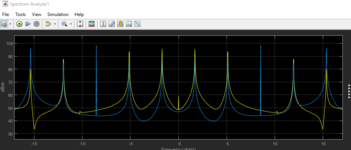
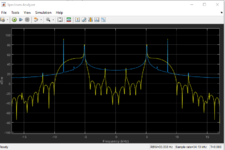
When I export the signal tap I have a sample vector and I would like to understand how to go about filtering it
i know filter desiner so i would use the same parameters as fir compiler but the problem i have to do something for the samples.
Given that I know how to export the data from the signal tap, I need to process them in matlab.
I created a signal called ADC_DB and another ADC_DB_filter.
These two signals represent a filtered and unfiltered signal by fir filter.
I tried filtering through HW and found that the filter works. But I have to try to do the same thing through matlab.
When I export the signal tap I have a sample vector and I would like to understand how to go about filtering it
i know filter desiner so i would use the same parameters as fir compiler but the problem i have to do something for the samples.
") i can't
i can't