Continue to Site

Welcome to EDAboard.com

Welcome to our site! EDAboard.com is an international Electronics Discussion Forum focused on EDA software, circuits, schematics, books, theory, papers, asic, pld, 8051, DSP, Network, RF, Analog Design, PCB, Service Manuals... and a whole lot more! To participate you need to register. Registration is free. Click here to register now.

Multiple dips on S(1,1) Plot- VNA results

Status
Not open for further replies.

Amra1

Newbie
Joined
Dec 29, 2022
Messages
3
Helped
0
Reputation
0
Reaction score
1
Trophy points
11
Activity points
33
Hello everyone,
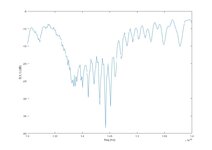
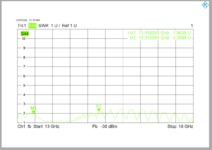
I have been working on Parallel Series Fed Microstrip patch antenna array in Ku Band. It is fed with a probe feeding method and designed & simulated on CST. After fabrication, checked its S(1,1) on VNA, multiple dips in S(1,1) plot are observed. What does this tell us about the behavior of the antenna?
Images are attached for reference.
 

Attachments

  • S-Parameters (Ku Band).jpg
    S-Parameters (Ku Band).jpg
    53.7 KB · Views: 107
  • VSWR.png
    VSWR.png
    58.2 KB · Views: 96

You compare dB(S(1,1)) with VSWR. This is wrong. Change the measurement quantity being as dB(S) at VNA.
 

It is actually plotted in Matlab after taking data of dB(S) from VNA. I gave the title of db(S(1,1)) myself. This is the reflection coefficient plot of the antenna. What I want to ask is that what does this type of plot depict, with so many dips and abrupt changes? Is there any particular behavior that we can conclude from such result? I didn't have such changes in my simulation results.
 

We could understand the results better if we knew the antenna dimensions and test setup geometry. In case of doubt, the about 100 MHz delta corresponds to room reflections and feed cable common mode wave resonances. Presume you don't use anechoic chamber and effective common mode isolation?
 
It is actually plotted in Matlab after taking data of dB(S) from VNA. I gave the title of db(S(1,1)) myself. This is the reflection coefficient plot of the antenna. What I want to ask is that what does this type of plot depict, with so many dips and abrupt changes? Is there any particular behavior that we can conclude from such result? I didn't have such changes in my simulation results.
You either have plotted in MatLab or by something different tool, no matter.
You HAVE to compare same quantities to able to compare the results and I still see two different quantities are in intention to compare. If you use a VNA, you can easily switch from VSWR to dB(S) then compare.
 

i have tested lots of antennas that have multiple S11 dips at different frequencies.
they do not necessarily mean that the antenna is "tuned" at any one of those dips!
what i like to also do is have a standard gain horn handy, and simultaneously measure S21 magnitude between the test antenna, and the standard gain horn maybe a foot away. when it get an S11 minimum, AND simultanelously an S21 magnitude maximum, THAT is where the antenna is tuned.

as an example of a spurious antenna response, lets say i made an "antenna" by soldering a 50 ohm chip resistor at the end of a piece of semirigid cable. It would have a very low S11 magnitude, right? but it would make very poor radiator. Similar sort of loss mechanisms can go on inside an antenna, where instead of radiating at an S11 dip, it might just be turning all the incident power into heat!
 
Status
Not open for further replies.

Part and Inventory Search

Welcome to EDABoard.com

Sponsor

Back
Top