Vermes
Advanced Member level 4

It is a design of an intelligent meteorological station. It is an unusual project, able to predict the air temperature for the next 24 hours.
Artificial neural network was used for this purpose.
The station records the temperature every minute and presents the temperature distribution of the last two days on the display in graphical form. Besides, it calculates sunrise, sunset and moon plase.
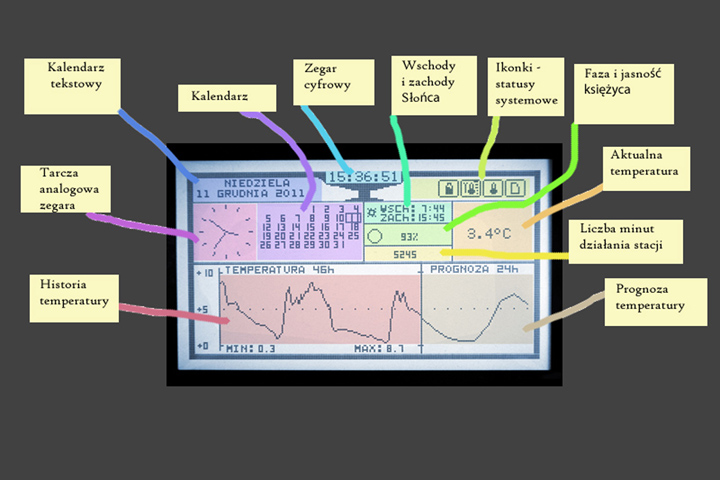
The picture below explains what you can see on the display:
Purpose:
The main idea was to create a sophisticated and autonomous temperature recorder. Also there is a graph (histogram) showing the change of temperatures over the past several hours. Another idea was the possibility of to connect an external, more distant sensor (up to several tens of meters). The most difficult goal was to forecast the temperature. For this purpose, artificial intelligence was used.
The station currently measures only temperature. Pressure sensors and/or humidity can be added.
Hardware:
- Microcontroller: Atmega128 operating at a frequency of 16MHz
- Memory: 64KB XRAM (64KB of 128KB) + 74HC573
- Clock: DS1307N
- Thermometer: DS18B20
- Receiver: RX433
- Display: GLCD 128*240
- Memory card slot: RS-MMC/SDHC
Software:
Atmega was filled in 80%. The source code consists of 5800 lines. Below some of the subroutines and functional blocks of the device are described.
File system:
Programmatic support for file system is provided by AVR-DOS.
Reader RS-MMC/SDHC was used for communication with a memory card. It communicates with the microcontroller via the software SPI interface.
Before each record on the memory card, its physical presence is checked. If the card is not inserted or the card has physical or logic errors – an error is indicated in the form of crossed icon of the card. Record is skipped in such a case. A separate text file can be created for each day (e.g. 22-05-11.txt), where an arithmetic mean of 60 samples made every one second is appended every minute. Each file is finished by a short report indicating the minimum, maximum and average daily temperature. Additionally, error.txt file is created in which the dates and times of all starts and resets of the system are recorded, with an indication of the point in the program, at which the reset occurred.
Temperature sensor:
A digital temperature sensor DS18B20 from Dallas Semiconductor was used for temperature measurement. It communicates with the microcontroller via 1-Wire bus. The sensor allows you to measure temperatures from -55 to +125 degrees Celsius with a resolution of 0,0625 degree Celsius. The measured temperature is rounded to 0,1 degree Celsius, although the average accuracy is +/- 0,5 degree Celsius. The presence of the sensor is checked before each measurement. In the case of its absence, the appropriate icon on the display should be crossed. If errors occur in communication with the sensor (CRC check), the icon is also crossed. In both cases, the result of the current temperature measurement is not displayed, and the result of the last measurement goes to the statistics. Temperature is measured every 1 second, and the measurement value is displayed with an accuracy of 0,1 degree Celsius in the appropriate place on the display. The sensor is connected to the station though a few meter cable. This gives the possibility of placing it on the outside (e.g. outside the window).
Radio sensor:
Alternatively to the wire sensor, there is a wireless radio sensor. The idea was to increase the mobility of the station (the possibility of putting it anywhere). The probe works well in a range of up to approximately 15m with a few walls along the way. The maximum measured range in the open air was a distance of 120m. Transmission frequency is 433MHz. The data are sent via the UART at 1200 baud.
To minimize errors, packet transmission was applied. Every minute four identical packages are sent. Each package is 8 bytes.
Two bumpers bytes, two address bytes, two bytes with the value of the temperature, battery status byte and CRC control byte. Receiver (the receiving subroutine) discards the package if it does not meet the requirements (address, CRC).
During the 20-day test of the transferred data correctness, it turned out that there was only a few fake packets, which is a satisfactory result. Without packet transmission, false values reached up to several times per second.
The picture below shows the course of the data in the packet with a length of 6 bytes.
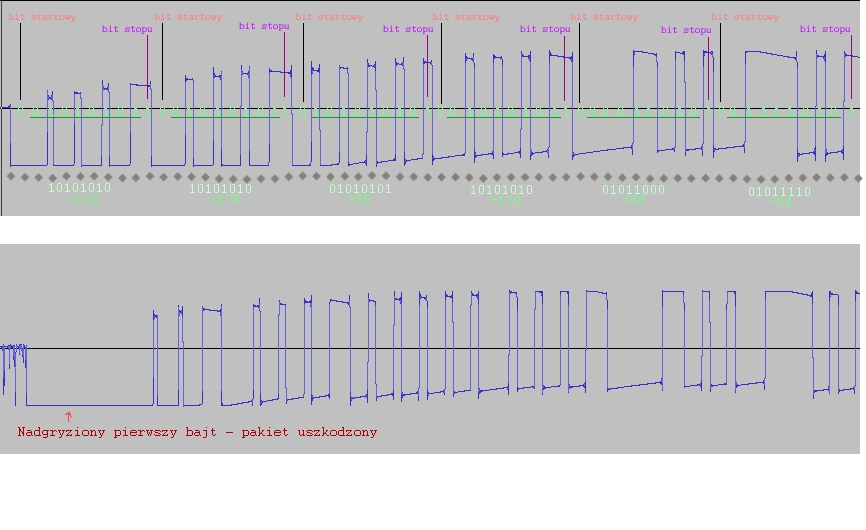
The transmission part consists of a microcontroller Attiny2313, TX433 transmitter (Velleman), DS18B20 temperature sensor and stabilizer 78L05. Power supply is a 9V battery. Concerning about the low efficiency of the battery during the winter (freezing and rapid consumption of the battery), radio sensor is now replaced with a wired version.
Clock:
To measure time, a real-time clock DS1307N was used. It communicates with the I2C bus. System is connected to the battery for the clock maintenance (for several years) in the absence of main power. The system has RAM (56B), in which information about summer/winter time are stored.
Summer/winter time:
Twice a year, the device automatically changes the time from winter to summer or vice versa.
Calendar:
The time is displayed in the digital and analog form. The display shows two clocks and two calendars: text and table. For the purpose of table version, leap years are additionally calculated. The current day is indicated by a flashing rectangle.
Moon phases:
The current phase of the moon is calculated every day. It is presented as 1 of 8 icons representing the moon. The approximate brightness of the moon expressed in percent (0% - new moon, 100% - full moon). The algorithm calculating the moon phase is based on the average value of synodic month.
Sunrises and sunsets:
Another astronomical algorithm is an algorithm that calculates sunrise and sunset time. It calculates the position of Earth relative to the Sun, taking into account the spin and rotating of Earth. Time of sunrise and sunset is calculated for specific geographic coordinates and showed on the display.
Backlight adjustment:
The station automatically changes the backlight level. It has two backlight modes: day and night. Instead using the light level sensor, the “knowledge” of the station of sunrise and sunset times was used. Mode change occurs just after sunrise or sunset.
Frame buffer:
The entire content of the screen is buffered in the external XRAM memory before displaying. To display the texts. Three different types of fonts were used. To view the rest, a modified implementation of the Bresenham algorithm was used.
XRAM:
In the external XRAM memory, the screen buffer and temperature graph buffer are stored. Also data needed to “restore the system” after momentary power failure or reset and a few control bytes are stored.
Restoring the system:
In case of accidental resets or suspensions of the program, the option “Restore the System” was added. The system simply detects how long before the start, it worked properly. If it was several hours ago, a full run is made (all variables reset).
If the interruption in the operation of the system was e.g. several seconds, the system returns to work, using variables from XRAM memory. It verifies accuracy of the memory data before by comparing the control variables in it with the expected values.
Icons:
In the upper right corner of the screen you can see several icons. They show the status of the memory card (working / not working / saving) and the temperature sensor (working / not working). Thermometer icon with the antenna indicates the presence and the level of the signal of radio sensor. The signal level is calculated based on dividing the number of packets expected.
The icon with the battery shows the power voltage level of a possible battery. At the moment it is inactive, because the system is powered from the AC adapter.
Temperature chart:
At the bottom of the screen a graph of temperature is drawn. Actually, it is divided into two different connected graphs: a historical graph of the 46 hours and a forecasted for the next 24 hours graph.
The historical part presents the temperatures of the last two days. As time goes, it scrolls left, and new values appear at the vertical line separating the two graphs. This chart is moved by one point to the left every 20 minutes. Then another point is added with a value representing the arithmetic mean of 1200 last sample temperatures made every one second (average of 20 minutes). The graph is drawn by the method of a number of interconnected sections (exactly 138). During each update of the chart, auto scale is done. Values of the upper and lower divisions are set then, and the vertical resolution is changed. Graphs are drawn correctly for temperatures from -40 to +100 degrees Celsius.
Forecast:
One of the most difficult stages of creating this project and the most time consuming was to develop a relatively efficient method of temperature forecast. Artificial intelligence was used to predict the temperature.
Artificial intelligence:
The mechanism of artificial intelligence in this project is an artificial neural network (a single scholar artificial neural network, because the learning process of such a network is quite fast).
Neural network is composed of 48 neurons and 512 synapses. This is a multi-layer perceptron, trained by backpropagation. Sensory layer has 24 neurons. Synaptic layer (hidden) has 16 neurons. The output layer has 8 neurons.
Neural network was taught from 10 years climatology database, collected for a certain city.
A set of about 30 000 learning (training) samples was prepared to study on the basis of the base mentioned above. Learning samples were initially randomly mixed. This allowed to achieve noticeably better results. The learning process for the set of training data from a 10-year period was repeated 50 000 times. Total time of learning lasted 3 weeks. During this time, many different models were checked and the most optimal was chosen.
The chart below shows the composition of predicted and measured data for 9 days (this is not a 9 days forecast).
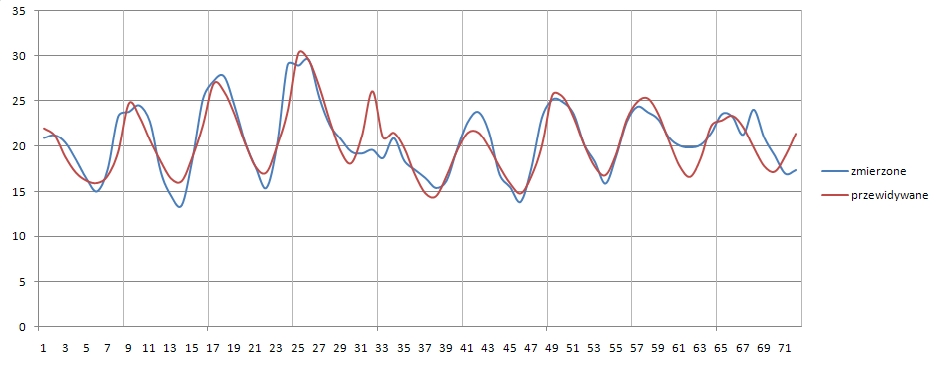
After checking the accuracy of the temperature forecast for the different months, it turned out that the average forecast error is 1,7 degrees Celsius and average relative error is 6,7%.
Pearson correlation coefficient between the forecasted and measured data reached 0,96. The operation of the network is a little better in the summer than in the winter. Perhaps it comes to violent temperature contrasts, occurring sometimes in the winter.
Link to original thread (useful attachment) – Inteligentna Stacja Meteorologiczna V1 - sztuczne sieci neuronowe w praktyce