Continue to Site

Welcome to EDAboard.com

Welcome to our site! EDAboard.com is an international Electronics Discussion Forum focused on EDA software, circuits, schematics, books, theory, papers, asic, pld, 8051, DSP, Network, RF, Analog Design, PCB, Service Manuals... and a whole lot more! To participate you need to register. Registration is free. Click here to register now.

help needed in analysis of ECG Signal using MATLAB

Status
Not open for further replies.

shaikh105

Member level 1
Joined
Jul 3, 2007
Messages
35
Helped
2
Reputation
4
Reaction score
2
Trophy points
1,288
Activity points
1,572
rdsamp.exe

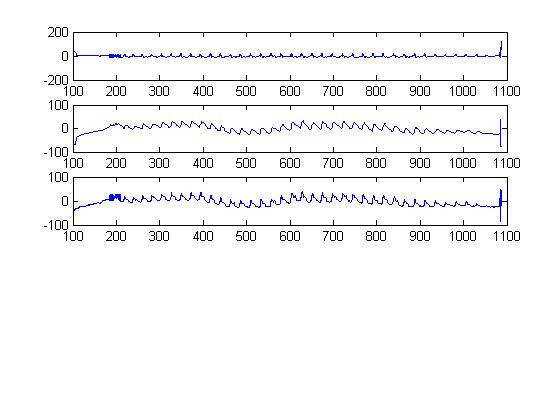
i have collected samples of ECG , 10 sec each. i converted them to one-D signal . Now the ECG signal is present with me as Ft=[a s d .......],,, ok
I want to remove
1. 60HZ frequency component
2. base line drift.
Can any body who played with ECG signal help me with some ideas using matlab.
 

removing baseline drift from ecg

Could you please upload the samples?
Thanx
 
reading data in physionet in matlab

https://obrazki.elektroda.pl/84_1183521201_thumb.gif[/img]


i have collected these samples from physionet,,,,,,,,,,,,,i mean copy paste from that site,,,,,,,,10 sec smple each.

Added after 13 minutes:

auto_mitch said:
Could you please upload the samples?
Thanx
thanx for the response, and here is a sample,,, plus i collected my samples from Physionet
 

how to read a signal using matlab

Can you upload the numerical data, or give a link to the data file? A small one please, not a 60MB file!
Please include essential info such as sample rate and scale factors.
Can you show us your code that reads the file into Ft=[a s d ...]?
 

how to remove baseline drifting in matlab

echo47 said:
Can you upload the numerical data, or give a link to the data file? A small one please, not a 60MB file!
Please include essential info such as sample rate and scale factors.
Can you show us your code that reads the file into Ft=[a s d ...]?
i tried to upload but it is not taking up .m file here
ok let me explain,, i had a png file , i converted that to 1's and 0s,,, then i targeted 0'z which contains the ecg wave form
then i plotted those 0'z against time axis... thats all
find the data attached in the vector "Ft"
 

open source for analysis of ecg at matlab

Wow, you really read the data points from a bitmapped plot! If you simply need example ECG data, wouldn't it be easier to use one of the raw data files that I see on Physionet? (Assuming you know how to get the data into MATLAB, such as by using WFDB_tools or rdsamp, both available on Physionet.)
https://www.physionet.org/physiobank/database/#ecg

What is the sample rate of your data.doc? Need to know that for filtering.

I'm no ECG expert, so someone else please jump in here and help!

EDAboard rejects most file attachments unless you ZIP or RAR them first.

Here's a copy of your data in simple ASCII format, in case someone else can't read your MS Word doc file.
 

mean square error matlab

echo47 said:
Wow, you really read the data points from a bitmapped plot! If you simply need example ECG data, wouldn't it be easier to use one of the raw data files that I see on Physionet? (Assuming you know how to get the data into MATLAB, such as by using WFDB_tools or rdsamp, both available on Physionet.)
https://www.physionet.org/physiobank/database/#ecg

What is the sample rate of your data.doc? Need to know that for filtering.

I'm no ECG expert, so someone else please jump in here and help!

EDAboard rejects most file attachments unless you ZIP or RAR them first.

Here's a copy of your data in simple ASCII format, in case someone else can't read your MS Word doc file.
No , as u see i produed my data myself ,, so therefore , i wannna filter that now
u please help me how to filter it ,,,, bcz its just one sample i send u ,,,, i have 100 samples and i wanna apply these 60 HZ removal and base line drift from them.
i don't want to use data available at physionet. you please help me with some better idea to apply these filters and please help me implement that into my code
 

read signal tin matlab

But you said, "i have collected these samples from physionet". Oh well, the data source isn't important.

However, it's impossible to apply a frequency filter without knowing the data sample rate.

I don't know much about ECG. Is Figure 3 and it's associated paragraph a good example of the baseline-drift removal that you wish to do?
https://www.dataq.com/applicat/articles/an14.htm

The moving average described on that web page is easy to implement with MATLAB's "smooth" function. In the following example, I assumed the data sample rate is 250 Hz, and the waveform period is about 130 samples. Does this look like what you expected?

Code:
% Input data and plot it
y = textread('ecg.dat')' * 1e-6;        % assume data is microvolts
fs = 250;                               % sample rate
period = 130;                           % samples per waveform period
N = length(y);
t = (0 : N-1) / fs;
subplot(2,1,1); plot(t,y*1e6); xlim([0 max(t)]);
title('Input Data','FontWeight','bold'); xlabel('Seconds'); ylabel('Microvolts');
xlim1 = xlim;  ylim1 = ylim;            % remember plot limits
%
% Subtract baseline drift. See [url]https://www.dataq.com/applicat/articles/an14.htm[/url]
z = y - smooth(y,period)';
subplot(2,1,2); plot(t,z*1e6); xlim([0 max(t)]);
title('Subtract Baseline Drift','FontWeight','bold'); xlabel('Seconds'); ylabel('Microvolts');
xlim(xlim1);
 
matlab: ecg waveform

echo47 said:
But you said "i have collected these samples from physionet". Oh well, the data source isn't important.

However, it's impossible to apply a frequency filter without knowing the data sample rate.

I don't know much about ECG. Is Figure 3 and it's associated paragraph a good example of the baseline-drift removal that you wish to do?
https://www.dataq.com/applicat/articles/an14.htm
the sample rate is:
sampling rate= length(yy)/10
now pls tell me wat to do
 

how to implement ecg waveforms using matlab

"sampling rate= length(yy)/10"

What is yy?

Whatever yy equals, that equation doesn't seem right. Sample rate is usually a constant, dependent on the instrument's A/D converter design, not the length of some array.
 

smoothing ecg data using matlab

echo47 said:
"sampling rate= length(yy)/10"

What is yy?

Whatever yy equals, that equation doesn't seem right. Sample rate is usually a constant, dependent on the instrument's A/D converter design, not the length of some array.
 

ecg extraction using matlab

What is s4.png? I don't have it, and yy depends on it.

That code appears to read data from a bitmapped plot, and length(yy) depends on the plot width and the quantity of dark-colored pixels.
If that's true, then "sampling rate= length(yy)/10" cannot be correct.

UPDATE:

Oooop! Your code has disappeared.
 

how to read ecg into matlab

echo47 said:
What is s4.png? I don't have it, and yy depends on it.

That code appears to read data from a bitmapped plot, and length(yy) depends on the plot width and the quantity of dark-colored pixels.
If that's true, then "sampling rate= length(yy)/10" cannot be correct.

UPDATE:

Oooop! Your code has disappeared.
yes you are right ,,, but i don't have the other information i.e the sampling rate through A/D of machine . i am sorry i don't have. secondly, your code, you send to me, for base line drift removal, is not working with my data. please advice me what to do. i am trying to apply matlab filters on it for e.g fir1,medfilt1 etc. which are not giving me good results. and please tell me how could i find sampling rate of data i got from physionet??? Should i follow the sampling rate mentioned in physionet for available data ?????or i have to calculate that at my own?????
this attached result may be read as at the bottem lies orignal signal, middle lies lowpass filterd signal, top lies orignal-lowpass signal. but you can see the results are not good. i used fir1 filter with matlab to get this result.

 
baseline drift removal using moving average

Tell me which data file(s) you are looking at on Physionet, and maybe I can help you determine the sample rate.

Show me your new data file, and maybe I can help you with baseline drift removal. Be sure you understand this sentence from my earlier message: "I assumed the data sample rate is 250 Hz, and the waveform period is about 130 samples." If you haven't adjusted those values to match your new data, the results will probably be bad. The baseline drift removal algorithm is described in the "an14.htm" link that I provided earlier. You should read it.

If you show me your fir1 and medfilt1 MATLAB code and data, then maybe I can see what's going wrong.
 
reading ecg in matlab

echo47 said:
Tell me which data file(s) you are looking at on Physionet, and maybe I can help you determine the sample rate.

Show me your new data file, and maybe I can help you with baseline drift removal. Be sure you understand this sentence from my earlier message: "I assumed the data sample rate is 250 Hz, and the waveform period is about 130 samples." If you haven't adjusted those values to match your new data, the results will probably be bad. The baseline drift removal algorithm is described in the "an14.htm" link that I provided earlier. You should read it.

If you show me your fir1 and medfilt1 MATLAB code and data, then maybe I can see what's going wrong.
well , i have randomly collected data from physionet then i sliced that into the form i already pasetd here, u can see please. on the top. As physionet keeps ECG data in different form e.g 12 lead , 2 lead etc. i emphyasize on 2 lead. then i cut that image into two halves. this become my two samples ok. my interest is to collect 10 sec strip from physionet containing some abnormal condition. so i have collected 100 samples each 10 sec long randomly from physionet ok. Now i converted those from bitmap to 1D image ,, as u already see with my code.ok
Now i calculated the sample rate with which u are not agreed.
wat u suggess now,,,,,,,,,,,, to help me if u select one sample( i am not sending u but request to select one 10 sec sample from physionet please) from physionet and removes its base line problem ,,, i think i can apply that idea to all of my samples ok.
 

ecg signals database in samples

Stop using that bitmap scanning process! Your (disappearing) code resamples the data at an uneven rate, so it can't be filtered easily. No wonder you can't determine the sample rate. Instead, as I suggested earlier, download the data files from Physionet, and use their rdsamp utility to convert the binary data into a MATLAB readable text file with columns of numbers containing time and voltage samples.

Here is the rdsamp manual:
https://www.physionet.org/physiotools/wag/rdsamp-1.htm

If you are using Windows, download rdsamp.exe and wfdb-10.4.dll and libcurl-3.dll from here:
**broken link removed**

Now try processing a file. Download data files e0801.atr and e0801.dat and e0801.hea from here:
https://www.physionet.org/physiobank/database/edb/

Then convert the first 10 seconds of binary data into a text file:
rdsamp e0801 -l 10.0 -p > e0801.txt

Then try this:
Code:
clear;
system('rdsamp e0801 -l 10.0 -p > e0801.txt');  % extract 10 seconds of data
[t,y] = textread('e0801.txt','%f %f %*f');      % read time and voltage from data file
fs = 1 / (t(2) - t(1));                 % sample rate, hertz
period = 0.96;                          % cardiac period, seconds
N = length(y);
t = (0 : N-1) / fs;
subplot(2,1,1); plot(t,y); xlim([0 max(t)]);
title('Input Data','FontWeight','bold'); xlabel('Seconds'); ylabel('Millivolts');
xlim1 = xlim;  ylim1 = ylim;            % remember plot limits
%
% Subtract baseline drift. See [url]https://www.dataq.com/applicat/articles/an14.htm[/url]
z = y - smooth(y,round(fs*period));
subplot(2,1,2); plot(t,z); xlim([0 max(t)]);
title('Subtract Baseline Drift','FontWeight','bold'); xlabel('Seconds'); ylabel('Millivolts');
xlim(xlim1);
See the output plot GIF image below.

Notice how the code calculates the sample rate from the first two time values.
If you use a different data file, you should also manually adjust the cardiac "period" value. Page an14.htm has more info.
I don't have an algorithm that automatically and reliably measures the cardiac period.
I haven't seen any obvious 60Hz hum in the Physionet data files that I downloaded, so I can't really test a 60Hz reject filter.

You may find some helpful data analysis functions here:
**broken link removed**
 

how to read a ecg signal in matlab

echo47 said:
Stop using that bitmap scanning process! Your (disappearing) code resamples the data at an uneven rate, so it can't be filtered easily. No wonder you can't determine the sample rate. Instead, as I suggested earlier, download the data files from Physionet, and use their rdsamp utility to convert the binary data into a MATLAB readable text file with columns of numbers containing time and voltage samples.

Here is the rdsamp manual:
https://www.physionet.org/physiotools/wag/rdsamp-1.htm

If you are using Windows, download rdsamp.exe and wfdb-10.4.dll and libcurl-3.dll from here:
**broken link removed**

Now try processing a file. Download data files e0801.atr and e0801.dat and e0801.hea from here:
https://www.physionet.org/physiobank/database/edb/

Then convert the first 10 seconds of binary data into a text file:
rdsamp e0801 -l 10.0 -p > e0801.txt

Then try this:
Code:
clear;
system('rdsamp e0801 -l 10.0 -p > e0801.txt');  % extract 10 seconds of data
[t,y] = textread('e0801.txt','%f %f %*f');      % read time and voltage from data file
fs = 1 / (t(2) - t(1));                 % sample rate, hertz
period = 0.96;                          % cardiac period, seconds
N = length(y);
t = (0 : N-1) / fs;
subplot(2,1,1); plot(t,y); xlim([0 max(t)]);
title('Input Data','FontWeight','bold'); xlabel('Seconds'); ylabel('Millivolts');
xlim1 = xlim;  ylim1 = ylim;            % remember plot limits
%
% Subtract baseline drift. See [url]https://www.dataq.com/applicat/articles/an14.htm[/url]
z = y - smooth(y,round(fs*period));
subplot(2,1,2); plot(t,z); xlim([0 max(t)]);
title('Subtract Baseline Drift','FontWeight','bold'); xlabel('Seconds'); ylabel('Millivolts');
xlim(xlim1);
See the output plot GIF image below.

Notice how the code calculates the sample rate from the first two time values.
If you use a different data file, you should also manually adjust the cardiac "period" value. Page an14.htm has more info.
I don't have an algorithm that automatically and reliably measures the cardiac period.
I haven't seen any obvious 60Hz hum in the Physionet data files that I downloaded, so I can't really test a 60Hz reject filter.

You may find some helpful data analysis functions here:
**broken link removed**


Dear friend , i am really thankful for ur kind help but i have problem in downloading what ever u said.bcz this doesn,t work when i followed all of ur message instructions . plz help.
 

download ecg sample signal

What download problem did you have?
Which step didn't work?
 

ecg ascii format example

echo47 said:
What download problem did you have?
Which step didn't work?


i have downloaded all , i mean rdsample.exe, wfdp-10.4.dll, libcurl-3.dll.
then i downloaded all data files e0801.atr.( all three u mentioned)
then i double click rdsamp.exe ,, but it didn't run at all
this didinot not run
rdsamp e0801 -l 10.0 -p > e0801.txt
i mean where i will run this command.
 

ecg signal analysis in matlab

Ok, easy answer! rdsamp is a Windows console application (a command-line program), so you can't simply double-click it.

One way to run it -- Open a Windows Command Prompt, change into the directory with all the downloaded files, and run the rdsamp command:
rdsamp e0801 -l 10.0 -p > e0801.txt

Another way -- Run the rdsamp command from inside MATLAB. This assumes all the downloaded files are in your MATLAB working directory:
system('rdsamp e0801 -l 10.0 -p > e0801.txt');
 

Status
Not open for further replies.

Part and Inventory Search

Welcome to EDABoard.com

Sponsor

Back
Top