Continue to Site

Welcome to EDAboard.com

Welcome to our site! EDAboard.com is an international Electronics Discussion Forum focused on EDA software, circuits, schematics, books, theory, papers, asic, pld, 8051, DSP, Network, RF, Analog Design, PCB, Service Manuals... and a whole lot more! To participate you need to register. Registration is free. Click here to register now.

HELP ME FIND THE EFFICIENCY..

Status
Not open for further replies.

marinara27

Member level 1
Joined
Mar 18, 2010
Messages
39
Helped
0
Reputation
0
Reaction score
0
Trophy points
1,286
Activity points
1,540
HELLO...CAN ANY1 HELP ME TO FIND THE EFFIENCY,,,
IM USING PSPICE WITH ORCAD SOFTWARE..
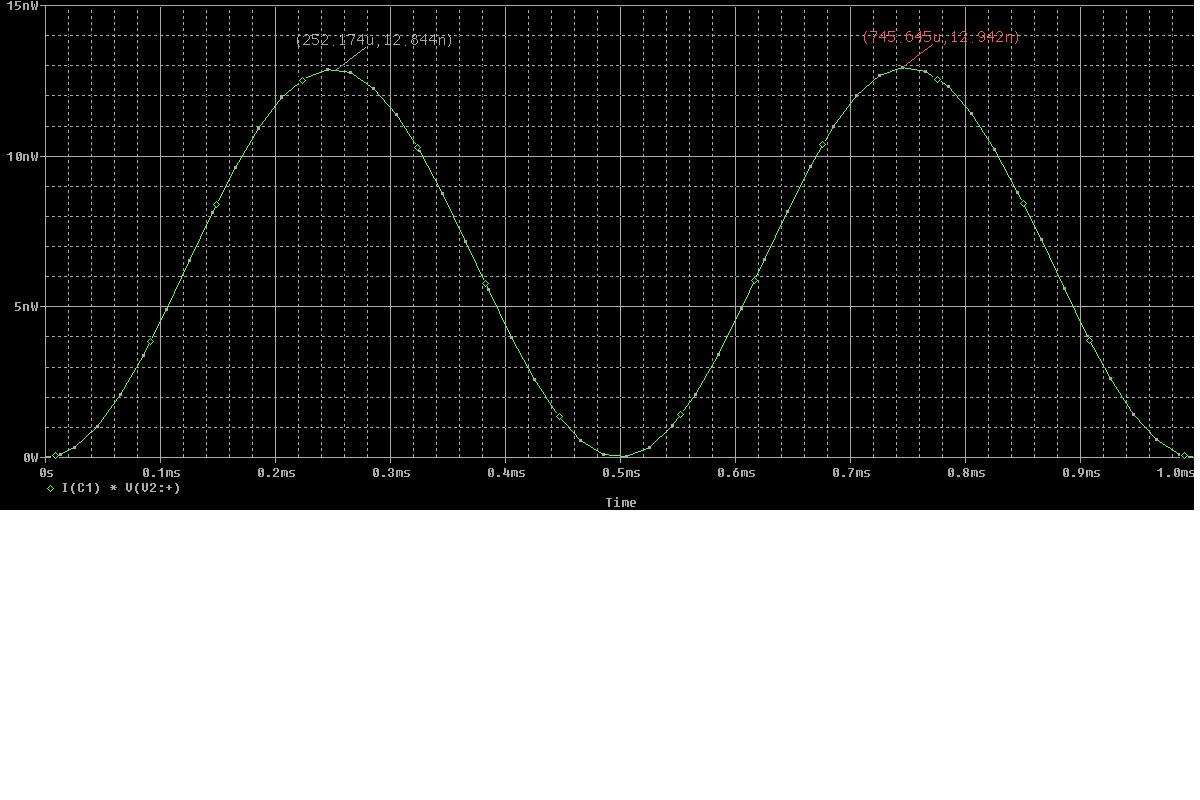
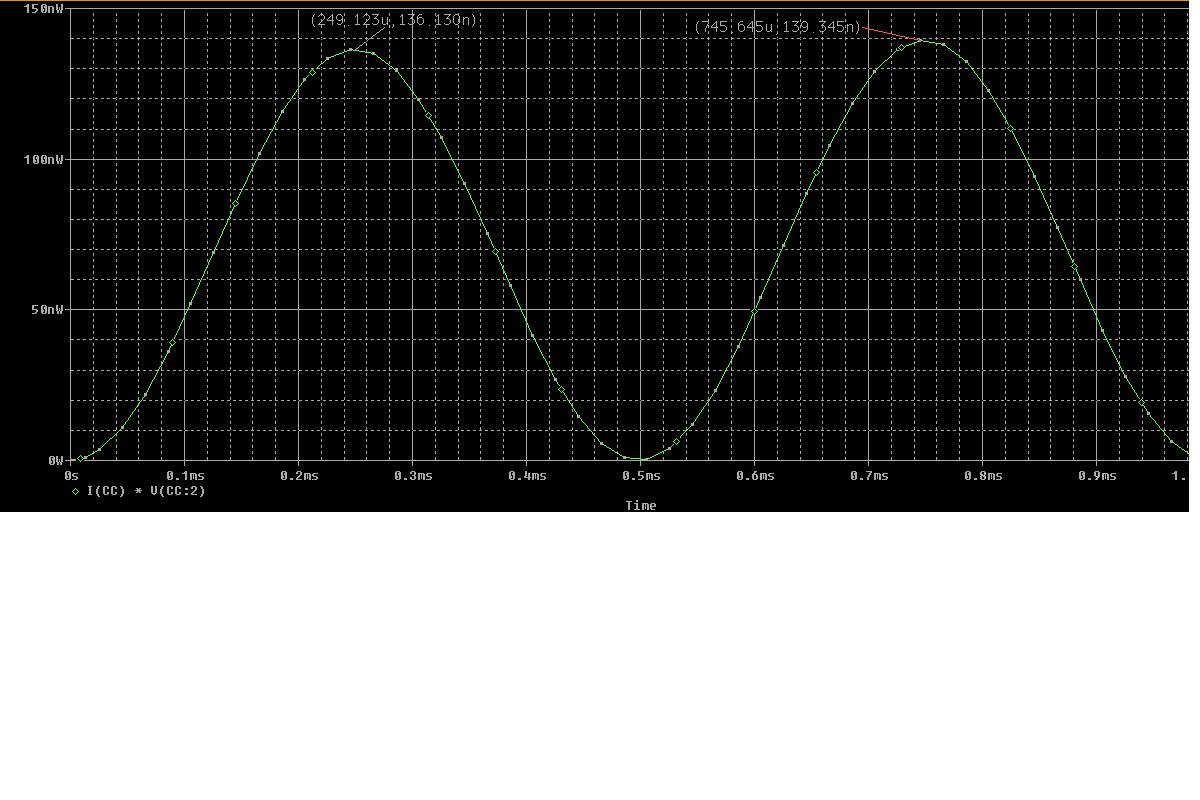
HOW CAN I PLOT A EFFICIENCY GRAPH..HELP ME ANALYZE THIS CIRCUIT..


Plot power in the load and power drawn from the power supplies. If the stimulus is an AC signal, as in your case, then I would suggest you run the transient analysis for an exact number of cycles and then average each of the measured powers before you work out the ratio.

Keith.
 

@keith

do u mean, plot graph of I*V for load?
if want to plot this type of graph, which type of spice anlaysis should i choose?
is it dc analysis?

i dont understand how to find the exact no of cycles (transient analysis)..
help me please..
 

You should be able to plot "power in a device". I don't use Orcad, but I believe there is that function. You should also be able to do it by creating your own functions - I*V as you say.

You need to use a transient analysis, for what you require.

For exact number of cycles, I mean if you use a 1kHz sine wave as the input, you need to simulate for 1ms, 2ms or 3ms ... etc. You don't want half cycles otherwise the result will be incorrect.

I have done a quick simulation to show you what I mean. The power in the voltage source V1 comes out negative because power is drawn from it, rather than dissipated in it. Efficiency is 4.14/9.51 * 100%. It will vary depending on the input signal amplitude & the load resistance.

Keith.
 

keith..

i understand the file u attach..
thank you very much..

actually, i do not know how to implement the 1st graph (graph of power) using pspice..

what type of simulation tool u use for this one?
 

I use SIMetrix. There was a similar post not long ago and the same sorts of functions are available in PSpice, but I don't know what they are called or how you find them. Have a look in the manuals for "power".

Keith.
 

in my pspice simulation cannot plot power..i have refer to a manual.. but do not have "power" function..
maybe it is something wrong with my pspice..
huhu..
 

You should be able to plot voltage*current. "add|trace" I think is what you need to do. You should then be able to type in an equation.

What version of Pspice is it?

Keith.
 

orcad release 9.1 version..
i able to plot I*V but i cannot using the transient analysis right?

if im not mistaken, if using transient analysis..the Y axis automatically time domain..

if i want to plot I*V, my Y-axis should be either Ivalue or Vvalue, right?

correct me if im wrong..
 

keith..i have already plot the graph of Pout and Pin separately in time domain.. can u please tell me how to measure the efficiency?


I am not what you have plotted, but the powers seem rather low - 123nW! I don't use Pspice so I don't know how you get a measurement from a waveform. On my simulator I simply select a waveform and select the measurement I want. I can then do the measurement between cursors or for the whole waveform, as I showed earlier.

I am afraid you need a Pspice expert. You might be able to plot AVG(V*I) but I am not sure what it will produce. You really want a measurement (i.e. a single answer) not a plot against time.

Keith.
 

There's apparently an importing misunderstanding. You are plotting input signal and output signal power. From this values, you
can calculate power gain, but not efficiency. Efficiency is the ratio of average output power to DC input power (assuming that
the signal input power can be neglected). If your amplifier has a low power gain, so that the input signal power can't be ignored, it
has to be added to the DC input power.

To calculate average values over a periode, you have an integral "S()" operator in PSPICE.

the powers seem rather low - 123nW
An efficiency measurement with a high impedance load actually doesn't make sense. Efficience is a power amplifier parameter.
You have to connect a nominal load resistor and apply a resonable input voltage to determine it.
 

so how can i plot the efficiency?

@FvM
i do not understand
"An efficiency measurement with a high impedance load actually doesn't make sense. Efficience is a power amplifier parameter.
You have to connect a nominal load resistor and apply a resonable input voltage to determine it."

can u please explain..really need help..
 

Status
Not open for further replies.

Part and Inventory Search

Welcome to EDABoard.com

Sponsor

Back
Top