Continue to Site

Welcome to EDAboard.com

Welcome to our site! EDAboard.com is an international Electronics Discussion Forum focused on EDA software, circuits, schematics, books, theory, papers, asic, pld, 8051, DSP, Network, RF, Analog Design, PCB, Service Manuals... and a whole lot more! To participate you need to register. Registration is free. Click here to register now.

how to calculate the threshold voltage and subthreshold swing from Log(Id) - Vg graph

Status
Not open for further replies.

electronicman26

Full Member level 2
Joined
Dec 15, 2011
Messages
120
Helped
2
Reputation
4
Reaction score
2
Trophy points
1,298
Activity points
2,054
Hi all
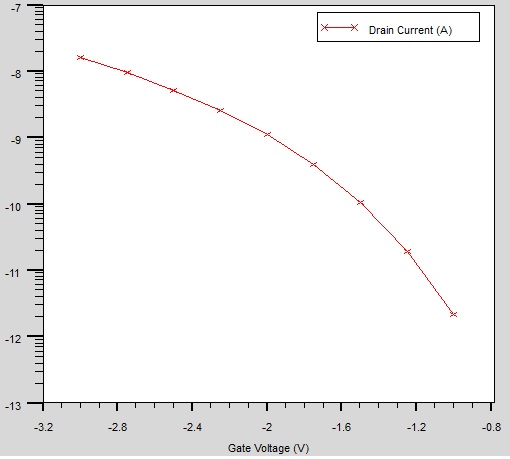
I have simulated a GAA-tunneling fet with Silvaco-TCAD, and plot the Log(Id) vs Vg graph:
Now, what is the value of threshold voltage and subthreshold swing? how can I extract and calculate these parameters?
 

The threshold voltage depends on your definition of the device's threshold current, usually 5 to 6 decades lower than the saturation current. In your case, a practical threshold current definition could perhaps be a value of 1pA , so the corresponding threshold voltage would be ≈-0.9V .

From your Id=f(Vd) curve I'd estimate a subthreshold swing - which is the required increase in gate–source voltage for a factor-of-10 increase in drain current - to ≈200mV/decade , s. here: GaAs-Tunnel-FET__Id_vs_Vg.png
 

Thanks dear erikl
I resimulate an IEEE Transaction paper "http://ieeexplore.ieee.org/abstract/document/6826562/?reload=true"
and this graph is one of the paper results, that I regenerate it with Silvaco TCAD
you are right in this paper Vth is taken to be -0.6V, but I want to calculate the Vth based on simulation, for this reason I find the code as below:
Code:
extract name="nvt" (xintercept(maxslope(curve(abs(v."gate"),abs(i."drain"))))-abs(ave(v."drain"))/2)
but this code results nvt=1.7628 , which part of code is wrong?
the paper said the TFET show a SS below 60 mV/decade, but simulation isnt in same, is it true?
is it possible to calculate the SS with the formula?
 
Last edited by a moderator:

... in this paper Vth is taken to be -0.6V

The author seems to have set the threshold current value for the threshold voltage to a much lower limit than I did: not to 1pA (10-12A), but perhaps to 1fA (10-15A). To get this threshold voltage value, you'd have to calculate and extend the Id=f(Vg) dependency down to such low Vg|Id value pairs.

Code:
extract name="nvt" (xintercept(maxslope(curve(abs(v."gate"),abs(i."drain"))))-abs(ave(v."drain"))/2)
but this code results nvt=1.7628 , which part of code is wrong?

I don't know this code syntax, but ... doesn't the (ave(v."drain") expression need min/max limits for the average calculation?
And why don't simply take the intercept of the curve itself (instead of its maxslope) with a self-defined threshold current value?
 
yes it is true
I don't know this code syntax, but ... doesn't the (ave(v."drain") expression need min/max limits for the average calculation?
And why don't simply take the intercept of the curve itself (instead of its maxslope) with a self-defined threshold current value?
this code is in example folder of software that calculate threshold voltage for a mosfet
it can be seen in the "Input Deck" part of https://www.silvaco.com/examples/tcad/section34/example1/
(in the last part of # extract device parameters )
if I want to calculate the subthreshold swing with software , how can I coded it?
for subthreshold slope I find this code:
extract name="psubvt" 1.0/slope(maxslope(curve(abs(v."gate"),log10(abs(i."drain")))))
input deck can be seen in https://www.silvaco.com/examples/tcad/section34/example10/index.html
 

Those charts look nothing like classical log-ID vs Vgs
pulls I've done or seen. A normal-ish MOSFET ought
to show several decades of log-linear drain current
below threshold, breaking away to square-law above
it. VT0 is usually fit to the extrapolated square-law
chart or series, from a point somewhere above the
bend (but not so far out that you get into stuff like
DIBL or impact ionization).

Now it may just be that this tunneling FET is not
well represented by classical models and equations.
You may be causing yourself extra and unrewarding
work, trying to hammer that triangular peg into the
round hole. Perhaps you want to just skip ahead to
straight behavioral, empirical modeling that gives
a useful emulation regardless of analytical form.
 

Status
Not open for further replies.

Part and Inventory Search

Welcome to EDABoard.com

Sponsor

Back
Top