Continue to Site

Welcome to EDAboard.com

Welcome to our site! EDAboard.com is an international Electronics Discussion Forum focused on EDA software, circuits, schematics, books, theory, papers, asic, pld, 8051, DSP, Network, RF, Analog Design, PCB, Service Manuals... and a whole lot more! To participate you need to register. Registration is free. Click here to register now.

[SOLVED] Bode Plot - Phase Margin (Magnitude start from 0 already) (How to find)?

Status
Not open for further replies.

Shinnster

Member level 4
Joined
Sep 15, 2009
Messages
70
Helped
1
Reputation
2
Reaction score
0
Trophy points
1,286
Location
Malaysia
Activity points
1,800
Hello everyone.

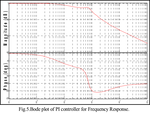
I can find the Gain Margin and Phase crossover frequency but I'm having problems finding the Phase margin for this bode plot.


some story: this bode plot is a freq response of a PI Controller from a paper. In the paper, he says phase margin is 88.8 degrees and Gain crossover frequency is 582 rad/s.....I tried to match them but they dont tally, so, can anyone help me?

Thanks a lot.

(you refer to 0dB on magnitude to find the phase margin right?)

can someone draw a 'red' line vertically where the phase margin is, and why?

Thanks. Seriously.
 

Attachments

  • Freq Response.png
    Freq Response.png
    62.9 KB · Views: 375

This is definitely not a PI controller transfer function which has a simple and well-known shape. May be it's the transfer function of the control process and the said parameters are describing the result of controller tuning.
 

Can agree with that however, back to the question, what is the phase margin of this bode plot?
 

Presumed it would be a loop gain plot (it hardly is), then you can't determine phase margin because there's no crossing of unity gain line.
 
This looks like the closed-loop response, rather than open-loop or loop gain, so it's hard to tell.
 

Thx guys I figured as much, just needed more feedback from others.
 

Thx guys I figured as much, just needed more feedback from others.

Perhaps it is up to YOU to give as a feedback (reply to posts 2, 4 and5).
For finding the phase margin you need the LOOP GAIN of the whole loop, not only the controller.
 
Can't give much since the paper did not provide any useful details that can reproduce their circuit->model (to find the actual values that is)

I'm aware of how to find the phase margin but I don't see how he get the phase margin of 88.8 degrees from just 'observing' this bode plot as stated in the paper.

[No, I'm not the one who published the paper, just analysing the paper but found this bode plot (freq response of PI controller) awkward]

The actual question is rather, is it even possible to get the values as stated in the paper (phase margin and gain crossover freq) even if its a rough estimate?

Maybe I asked the question wrongly hehe, my bad.
 

I suppose, the BODE plot in your first post is the closed-loop response in case a PI controller is used. (That means: it is neither any open-loop system nor the PI controller itself).
It is not possible to derive any PM from the figure (as mentioned bx FvM already) because it is NOT an open loop plot. This is obvious because the gain is not larger than unity.
Perhaps it helps to read the papaer again in order to understand what the drawings are showing.
 
I think the conclusion from this thread is enough for me.

Thanks all.

Regarding the plot, was labelled as, Bode plot of PI controller for Frequency Response.

And the follow is a direct quote from the paper. There are numerous errors in this paper [you'll see it in the following quote :X](not sure how this even got through IEEE conf)

"Further, the frequency response of the PI controller is plotted using the Bode plot which is given in Fig X. From Fig X we could observe that, the Gain Margin=15.9 db. With gain crossover frequency = 7.62x10³ rad.sec-1, and Phase Margin=88.8 deg. With phase crossover frequqncy=582 rad.sec-1. Since phase crossover frequency is very less than gain crossover frequency, the controller reveals that, the system is highly stable."

No other part of this paper discusses the Bode plot given.
 

"Further, the frequency response of the PI controller is plotted using the Bode plot which is given in Fig X. From Fig X we could observe that, the Gain Margin=15.9 db. With gain crossover frequency = 7.62x10³ rad.sec-1, and Phase Margin=88.8 deg. With phase crossover frequqncy=582 rad.sec-1. Since phase crossover frequency is very less than gain crossover frequency, the controller reveals that, the system is highly stable."
.

For my opinion, it is impossible to derive from the drawing some numbers as detailed as 15.9 dB or 7.62x10³ rad.sec-1 or 88.8 deg.
I mean not only the numbrs itself - I mean the exactness of these numbers.
I suppose, the article contains the wrong figure.
 

He used MATLAB to generate the values since this was a simulation done with MATLAB/Simulink...just plot bode and u can easily get those 4 values..

I think he probably included the wrong bode plot into the paper
 

Status
Not open for further replies.

Part and Inventory Search

Welcome to EDABoard.com

Sponsor

Back
Top