mtwieg
Advanced Member level 6
Recently I've been using GaN FETs in amplifiers, and have found that some of them have extremely nonlinear drain-source capacitance, while others do not. For example, here are two plots from two similar devices (roughly same size, Rdson, Qg, etc).
First, the EPC1013:
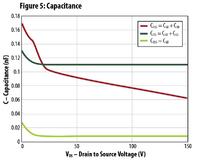
The curve of Coss (the red curve) for this one is severe, but not terribly surprising.
And second, the EPC2012:
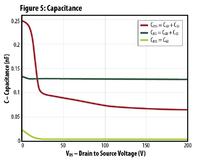
The nonlinearity here is much more extreme, and I can't think of any physical reasons to explain it. I'm wondering if it's due to different gate shielding, or to overlapping of the gate and drain/source terminals, but it's been a while since I've studied HEMT physics, and even then we never discussed nonlinearity.
I'm not a semiconductor designer, but I'm still very curious what the explanation for this behavior is. Any thoughts?
First, the EPC1013:
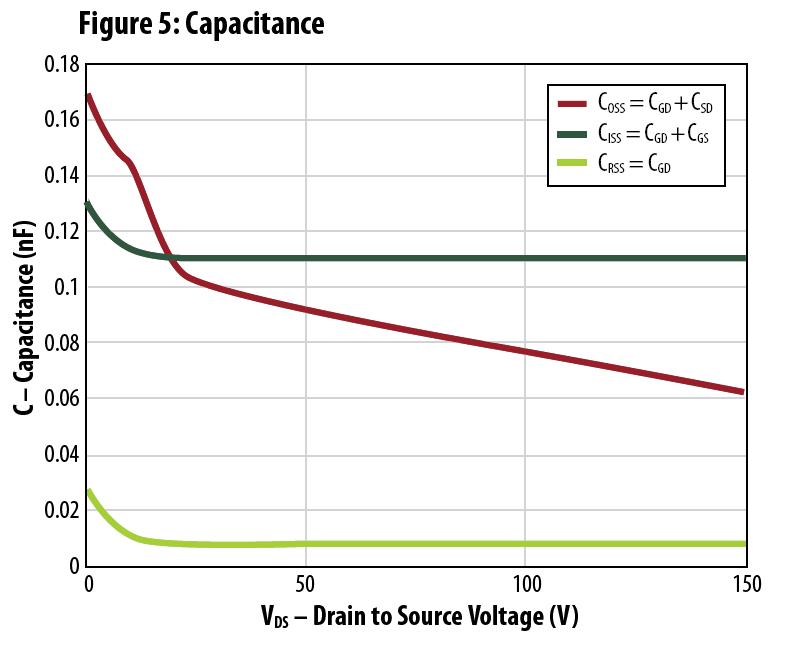
The curve of Coss (the red curve) for this one is severe, but not terribly surprising.
And second, the EPC2012:
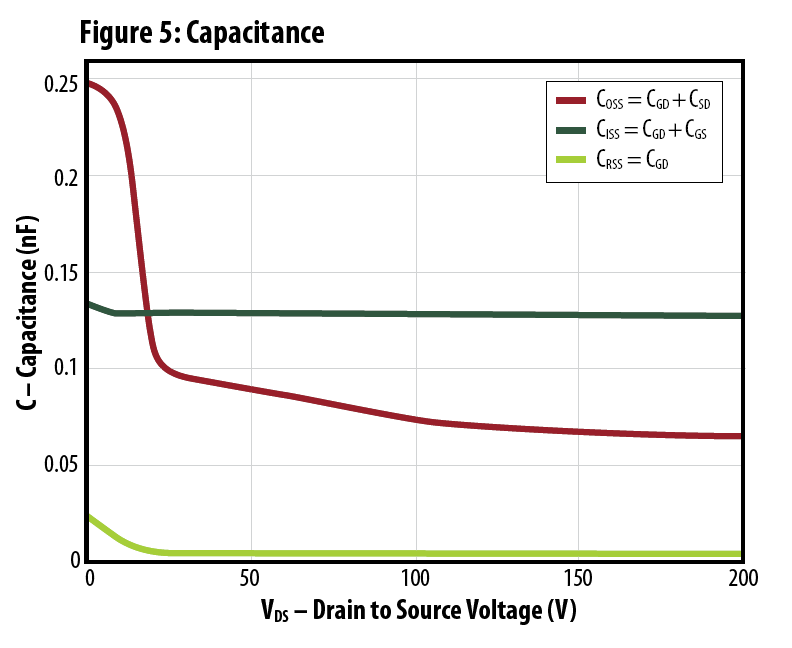
The nonlinearity here is much more extreme, and I can't think of any physical reasons to explain it. I'm wondering if it's due to different gate shielding, or to overlapping of the gate and drain/source terminals, but it's been a while since I've studied HEMT physics, and even then we never discussed nonlinearity.
I'm not a semiconductor designer, but I'm still very curious what the explanation for this behavior is. Any thoughts?