Welcome to our site! EDAboard.com is an international Electronics Discussion Forum focused on EDA software, circuits, schematics, books, theory, papers, asic, pld, 8051, DSP, Network, RF, Analog Design, PCB, Service Manuals... and a whole lot more! To participate you need to register. Registration is free. Click here to register now.
i am simulating multiband antenna in CST using 3 varactor diode now i want to plot s11 curve in same window for multiple values of capacitor (.1 pF to1 pF)
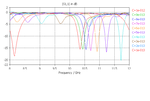
kindly tell me how can I do it in CST for reference i am uploading a sample figure
1) you can export your data in the ascii file then using another software such as excel/matlab to plot your data needed.
2) you can use template based post-processing to do it.
Hi,
Would you please tell me how you modeled the varators in CST? I am really in trouble doing that, Is it possible for you sending your CST simulation file? I really need it.
This site uses cookies to help personalise content, tailor your experience and to keep you logged in if you register.
By continuing to use this site, you are consenting to our use of cookies.