Continue to Site

Welcome to EDAboard.com

Welcome to our site! EDAboard.com is an international Electronics Discussion Forum focused on EDA software, circuits, schematics, books, theory, papers, asic, pld, 8051, DSP, Network, RF, Analog Design, PCB, Service Manuals... and a whole lot more! To participate you need to register. Registration is free. Click here to register now.

[SOLVED] Thevenin equivalent circuit

Status
Not open for further replies.

husny540

Member level 1
Joined
Aug 4, 2013
Messages
33
Helped
0
Reputation
0
Reaction score
0
Trophy points
6
Activity points
301
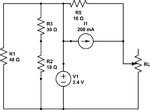
Using the thevenin's equivalent circuit, plot the variation VL, IL, and PL when the load resistance is changed from 10 ohm to 3o ohm and hence dtermine the load resistance which recieves maximum power.
I found the thevenin voltage as 5.6V and Thevenin resistance as 16 ohm. Plese help me with the question i posted
 

Attachments

  • thevinin image.png
    thevinin image.png
    14.2 KB · Views: 84
Last edited:

Hi,

The thevenin resistance is R5 and where is the voltage as 5.6 V ?
Because I see on this circuit diagram, a current source and resistance which are in parallel. I think you'd better use the Norton theorem.
 

Your two answers are right, you did well.


Hi Chris, it is V1 + I1*R5.

V1+I1*R5.My bad, I got it. But the current source mislead me.
 

Hi kerim I'm happy that my answers are correct, thankyou . i have asked a question on plotting the variation and finding the load resistance with maximum power, please read my question. I would be really happy if you would help me in this. thankyou

- - - Updated - - -

Hi chris, can you read my question and help me in plotting the variation and finding the load resistance with its maximum power
 

I'm sorry I don't have a good knowledge about the potentiometer. But, I going to try.
 

Now the equivalent circuit is very simple: Vth, Rth and RL.
I am sure you can find Vo (voltage on RL) then Po (power supplied to RL) in function of RL and the parameters Vth and Rth... right?
As you know, P=V*V/R

As Chris already mentioned it, we have here a voltage divider.
 

If I got it, when RL changes. The values of P, V and I change too. Right ?

- - - Updated - - -

Hi kerim I'm happy that my answers are correct, thankyou . i have asked a question on plotting the variation and finding the load resistance with maximum power, please read my question. I would be really happy if you would help me in this. thankyou

- - - Updated - - -

Hi chris, can you read my question and help me in plotting the variation and finding the load resistance with its maximum power

So, Have you found anything ?
 

Please read my question before reading this reply .PL=〖IL〗^2×RL = (VTh/(RTh+RL)) to the power of two×RL (PL-power of the load, VTh-thevenin voltage, RTh-thevenin resistance, RL-load resistance) So can i use this equation to find the power of the loads ? And just see whether these answers are correct ok . Power due to 10 ohm = 0.463 watt, power due to 20 ohm= 0.482 watt, power due to 30 ohm= 0.441 watt. These are what i calculated. So PL should be written in the y axis and RL in the x axis, am i right? Then what bout VL. Can you please plot the graph for me, then only i can find the load resistance which recieves the maximum power.
 

The main idea is to plot PL (Y axis) in function of RL (X axis).
As you know, in this case:
PL = Vth*Vth*RL/ (RL + Rth)^2

If RL = 0, PL = 0
If RL = infinity (open circuit), PL = 0 (since the power of RL in the denominator is higher than its power in numerator)

So it is clear, there is a maximum for PL.
Don't you recall how we can find the coordinates of the maximum point of a function (if it exists).
 
In my view it's correct because I don't know how to place V in the graph. I have thought the same thing as you. Regarding P is on y and R is on x. For exemple, we have R= 30 ohm and P= 0,441 Watt. We can found V thanks to this operation P= U^2/R >> U = sqrt(P*R).
 

Yes kerim that's true. The fact is i was wondering on why the question includes the VL also in yhe plotting case.Now i understand that only PL and RL should be taken into consideration. So by this we can find the load resistance with the maximum power.I have given some answers above for powers right can you say me whether are those correct. And will the load resistance in respect to the maximum power be around 20 ohm. By the way how can i plot this using microsoft word, is there any way to plot a graph
 

I just wonder if you learnt in math how to find the maximum/minimum points of y=f(x).

For example, if we have:
y = a*x^2 + b*x + c

Do you know how to find its maximum (or minimum)?

Here, for this circuit, the function is:
y = a * x / ( x + b )^2

where:
y = PL
a = Vth*Vth (given)
b = Rth (given)
x = RL (the variable)
 

I can draw the graph on Excel.
 

As you will find out and you will hear it a lot later during your studies in electronics, in this case PL maximum is reached when RL = Rth.

May I ask you if you learnt or not yet the derivative of a function?
If not, you have no choice but to plot the function in a way or another.

For instance:
P(10)=0.4639 W
P(16)=0.49 W
P(20)=0.48395 W
P(30)=0.4446 W
 
Last edited:
  • Like
Reactions: chri$

    chri$

    Points: 2
    Helpful Answer Positive Rating
OK i have found the powers for each load resistances right and now to plot the graph i insert the power values in the y axis and the resistance values in the x axis. Now what i want to know is how can i plot the graph using any microsoft office package. Because i have no idea at all to plot a graph in any microsoft office package whereas i can draw this on paper. so if i lot a graph only i can find the load corresponding to the maximum power.i know that RTh=RL . And also i want to know, in x axis we only have the values 10ohm, 20ohm, 30ohm and in the y axis the power values calculated, am i right? please make me clear because i have to definitely draw a graph for this . By the way derivative of a function- i learnt it by self studies

- - - Updated - - -

Chris, how am i to draw the graph on excel
 

To draw a graph on excel, here are the steps I follow:

On two horizontally adjacent cells, I enter the values of y1 and x1 respectively.
Below this pair, I enter y2 and x2... and so on... up to yn and xn

On the cell above x1, I write the name (label) of x (as RL).

Then I select the block from the cell above y1 down to the cell of xn. Therefore the selected block is formed by 2 cells horizontally and 1+n vertically (top header + n entries).

I open the "Insert" menu. The "Insert" button is at the right side of the "Home" one. Both are on the top menu bar.
Then in the sub-menu "Charts", I choose "Line" that gives me the option "All Chart Types..." from which I select (press) "X Y (Scatter)" and the graph will be drawn.
 
Last edited:

I drew the graph as you said and got it perfectly well Thanks a lot. In the first row of the first column i typed as PL(watt) and in the first row of the second column i typed as RL(ohm). The graph is perfectly displayed only with the PL being displayed and not the RL. what is the reason for this. And is the load resistance 20 ohm for the maximum amount of power.please say whether my answer is correct or not which would be really helpful
 

You are right, me too I have no idea why excel ignores on the graph what is written above x1! It displays, as you already noticed, only the content of the cell above y1.
For instance, at the right of the y column one may add another one for z1 to zn (also function of x) to get another trace on the same graph. In other words, the graph may have more than one plot versus x values (the leftmost column).

The maximum PL occurs, as it is mentioned earlier on post #15, when RL = Rth.
 

I have a doubt. I have already found the thevenin resistance as 16 ohm and now the load resistance to the maximum power is 20 ohm wheras RTh should be equal to RL at the maximum power.There is a contradiction right can you help me out?
 

Status
Not open for further replies.

Similar threads

Part and Inventory Search

Welcome to EDABoard.com

Sponsor

Back
Top