kydong
Junior Member level 2

- Joined
- Jan 24, 2010
- Messages
- 24
- Helped
- 0
- Reputation
- 0
- Reaction score
- 0
- Trophy points
- 1,281
- Location
- vietnam
- Activity points
- 1,446
Hi all,
I have trouble with spectrum visualization of OFDM signal.
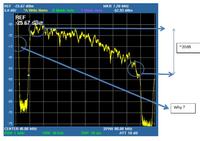
I implemented OFDM system on Stratix II ES180 board and convert the Q-signal to analog via on-board DAC 14bit. I got the result like the figure I attached.
I wonder why the firs edge and end edge of spectrum is far away to each other? the different is large: around 20dB (in the matlab simulation, I got the same level of them)
the second is, there is a mini circuit (transformer) before the DMA output, so, the DC component should be eliminated form signal, why I still get the DC component on the spectrum analyzer (see the figure I attached)
Thanks very much,

