BackerShu
Member level 3
sp analysis+cadence
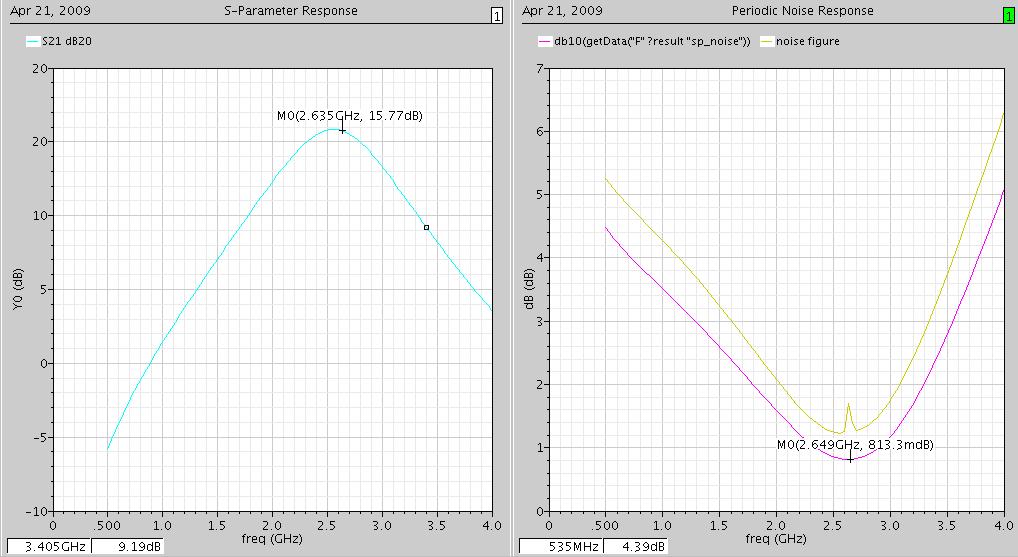
When I simulated the NF of a narrowband LNA use pnoise and sp analysis, some unpredicted difference results turned on as shown in Fig.1.
In the right subwindow, the yellow above line is the NF result by pnoise analysis, the other one is sp results.There are two differecces:
1)the NF of pnoise analysis is larger on the whole
2)there is a peak of NF of pnoise analysis
I did both the analysis follow the SpecterRF_UserdGuide_2003 realsed by Cadence.In fact, I know not so much about the pnoise and sp analysis settings. Could someone explain the results for me or show me how to do the correct analysis of the LNA NF.
Best wishes!!