Welcome to our site! EDAboard.com is an international Electronics Discussion Forum focused on EDA software, circuits, schematics, books, theory, papers, asic, pld, 8051, DSP, Network, RF, Analog Design, PCB, Service Manuals... and a whole lot more! To participate you need to register. Registration is free. Click here to register now.
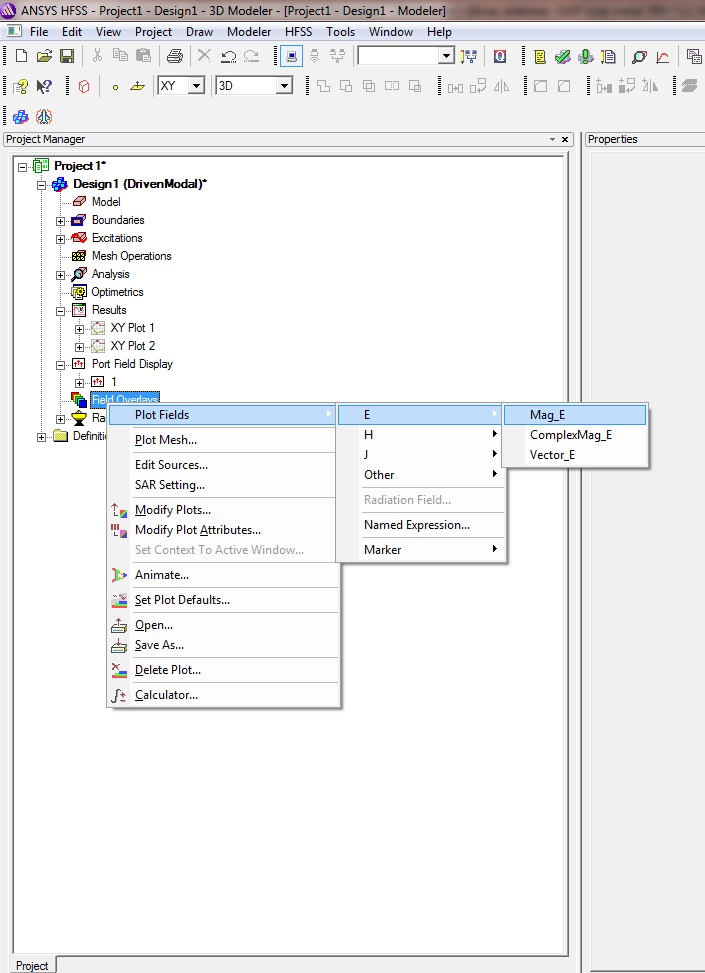
You need to create your own variable in the fields calculator. You can do this by selecting: E, then ComplexPhase, then Mag in the fields calculator. Save this expression. Then you can plot this under "named expression".
See "Plotting Derived Field Quantities" in HFSS help for more info.
Came across this thread because I am also interested in plotting phase of Efield (in the z-direction in particular) and was wondering what the best way was to go about it. PlanarMetamaterials response is helpful and I tried this, but it didn't give a reasonable result in a 2d plot of this value vs. element size. It did seem to give a reasonable result in the field overlays plots of this value.
However, what does taking the magnitude of the phase actually mean anyways? Meaning, what is the difference between leaving out the "Mag" and having it in there? If I take this literally as the magnitude, it seems like this is not what you want to plot if you are trying to plot just phase.
You need to create your own variable in the fields calculator. You can do this by selecting: E, then ComplexPhase, then Mag in the fields calculator. Save this expression. Then you can plot this under "named expression".
See "Plotting Derived Field Quantities" in HFSS help for more info.
Glad I was able to help. The reason why the magnitude operator is used here is because taking the complexphase of E gives a vector, which represents the relative phasing of the E-field along all axes. Taking the magnitude here give the phase of the total E-field (or another way to look at it is the average phase of each component of E). If you only want the phase of the z-component of the E-field, you would use the "ScalarZ" command instead of "Mag"
This site uses cookies to help personalise content, tailor your experience and to keep you logged in if you register.
By continuing to use this site, you are consenting to our use of cookies.