ali kotb
Member level 3
hello guys,
I need to draw a complex plot of certain impedance for a crystal resonator. (function of Quality factor). ie, Z(Q)
x axis : Re(Z) , y axis: Im(Z) , how can i do this in custom wave view on synopsys ?
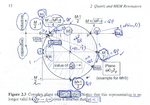
I need to plot a figure like the attached one
thanks
I need to draw a complex plot of certain impedance for a crystal resonator. (function of Quality factor). ie, Z(Q)
x axis : Re(Z) , y axis: Im(Z) , how can i do this in custom wave view on synopsys ?
I need to plot a figure like the attached one
thanks