talking
Member level 2

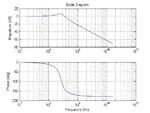
I have designed LC low-pass filter. The following code analyzes mag/phase bode plot of the filter.
You would see the phase curve shows from 0 to -180 deg from the results (see the attached.) of the following code. But it doesn't make sense, because ...
phase is defined as -arctan(w/wc), where w is frequency and wc is cut-off frequency. Whatever we have instead of w/wc, phase should not have the value lower than -90 deg.
But Matlab Bode function does as follows. Please help to understand this or correct my code for this issue.
Actually, it might be Matlab question, but I'm posting it here, since it can be solved by someone who has a background of LC filter design.
-------------------------------------------------------------------------
L = 15e-9; C = 24*1e-12; R = 50;
figure(1); num1 = [0 0 1]; den1 = [L*C L/R 1]; sys1 = tf(num1, den1);
[mag1, phase1, W1] = bode(sys1); mag_dB1 = 20*log10(mag1") ));
));
subplot(211); semilogx(W1/(2*pi), mag_dB1); title('Bode Diagram'); ylabel('Magnitude (dB)'); grid on;
subplot(212); semilogx(W1/(2*pi), phase1)); xlabel('Frequency (Hz)'); ylabel('Phase (deg)'); grid on;
You would see the phase curve shows from 0 to -180 deg from the results (see the attached.) of the following code. But it doesn't make sense, because ...
phase is defined as -arctan(w/wc), where w is frequency and wc is cut-off frequency. Whatever we have instead of w/wc, phase should not have the value lower than -90 deg.
But Matlab Bode function does as follows. Please help to understand this or correct my code for this issue.
Actually, it might be Matlab question, but I'm posting it here, since it can be solved by someone who has a background of LC filter design.
-------------------------------------------------------------------------
L = 15e-9; C = 24*1e-12; R = 50;
figure(1); num1 = [0 0 1]; den1 = [L*C L/R 1]; sys1 = tf(num1, den1);
[mag1, phase1, W1] = bode(sys1); mag_dB1 = 20*log10(mag1
));subplot(211); semilogx(W1/(2*pi), mag_dB1); title('Bode Diagram'); ylabel('Magnitude (dB)'); grid on;
subplot(212); semilogx(W1/(2*pi), phase1
)); xlabel('Frequency (Hz)'); ylabel('Phase (deg)'); grid on;Attachments
Last edited:

