maktoomi
Member level 2

- Joined
- May 19, 2012
- Messages
- 46
- Helped
- 4
- Reputation
- 8
- Reaction score
- 5
- Trophy points
- 1,288
- Location
- India
- Activity points
- 1,651
Hello,
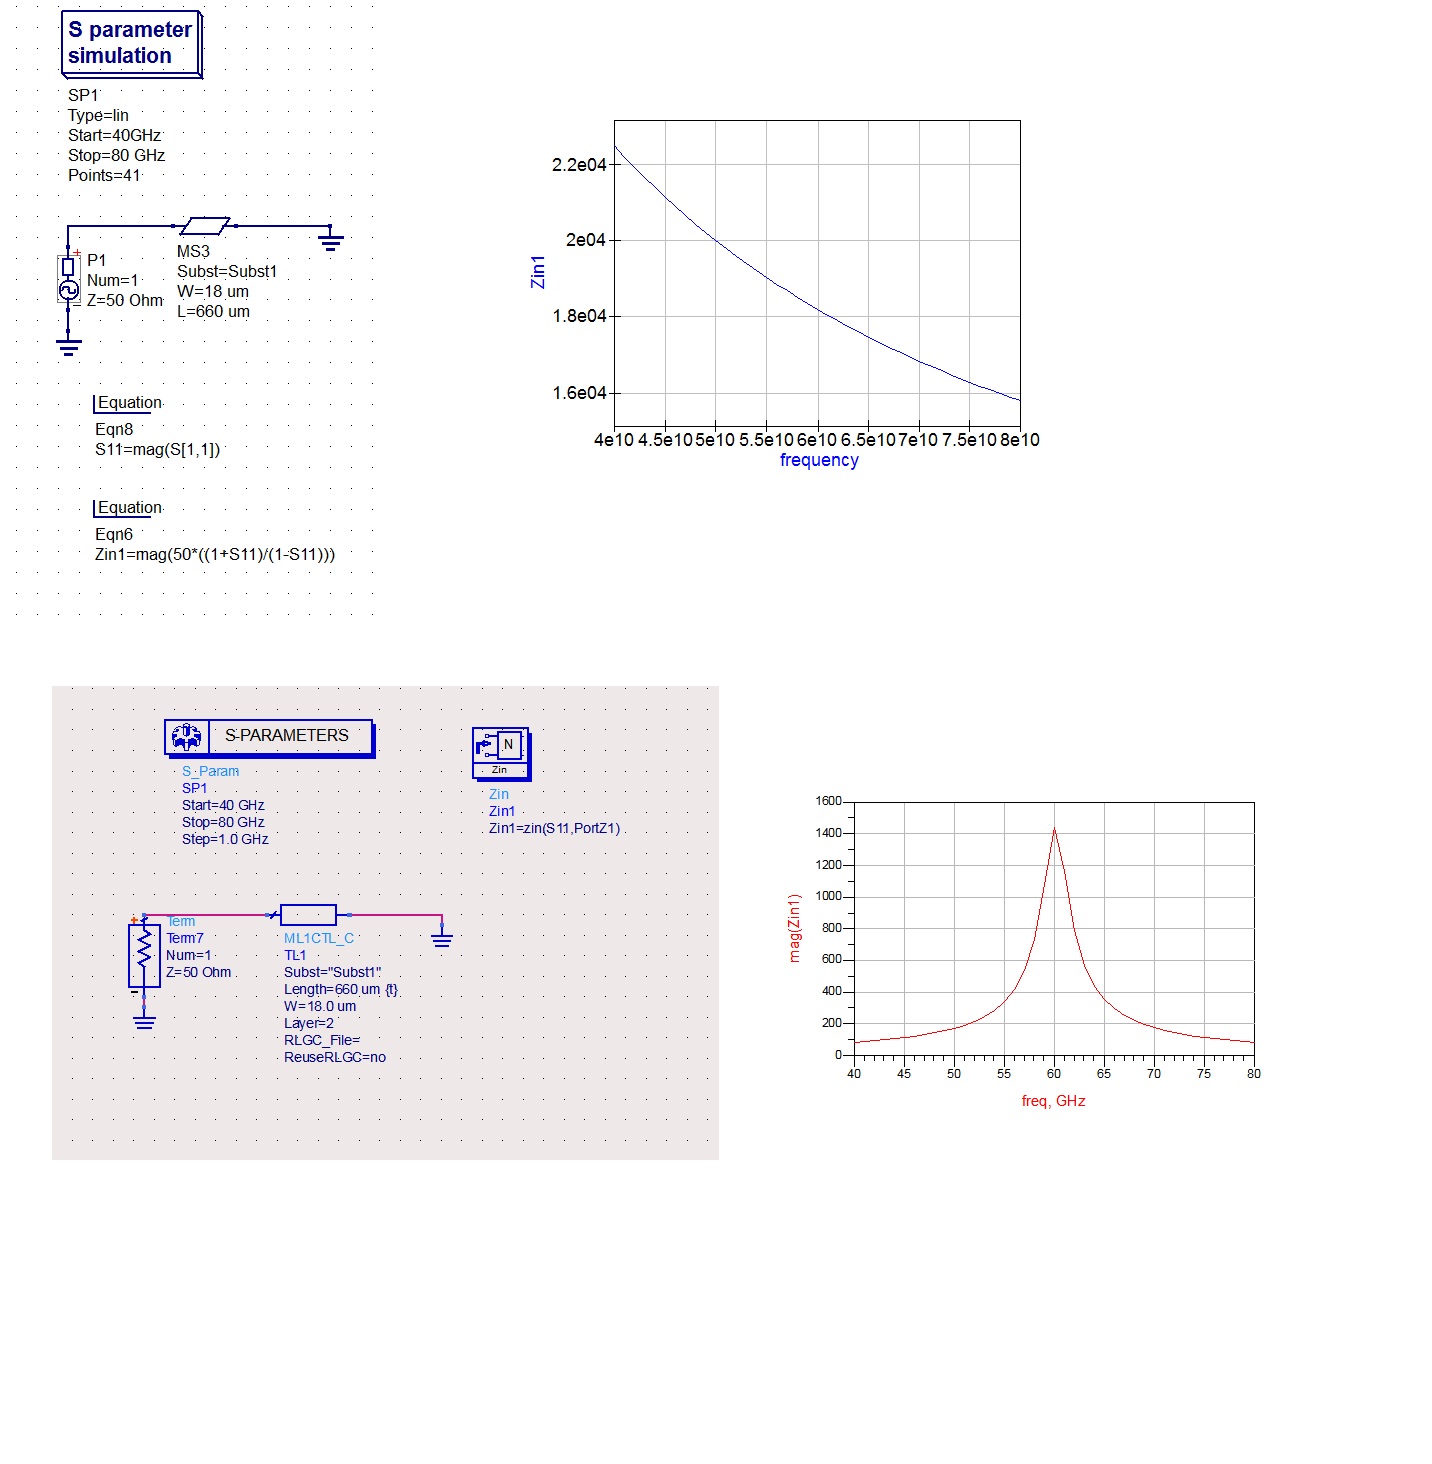
I am simulating a network given in a book using ADS.I have to plot the input impedance over a frequncy range.
See the following setup to I created do that:

I am getting following result:

Kindly help me with following two questions:
(1) What to do so that it resembles with the answer given in the book (hopefully that is correct!), see below

( why ads is showing smith chart from four directions)
(2) could you kindly explain the arguements used in Zin block? I learned it in some tutorial to add zin block but I couldn't find any explanation thereof.
Thanks.
I am simulating a network given in a book using ADS.I have to plot the input impedance over a frequncy range.
See the following setup to I created do that:
I am getting following result:
Kindly help me with following two questions:
(1) What to do so that it resembles with the answer given in the book (hopefully that is correct!), see below
( why ads is showing smith chart from four directions)
(2) could you kindly explain the arguements used in Zin block? I learned it in some tutorial to add zin block but I couldn't find any explanation thereof.
Thanks.