Continue to Site

Welcome to EDAboard.com

Welcome to our site! EDAboard.com is an international Electronics Discussion Forum focused on EDA software, circuits, schematics, books, theory, papers, asic, pld, 8051, DSP, Network, RF, Analog Design, PCB, Service Manuals... and a whole lot more! To participate you need to register. Registration is free. Click here to register now.

[SOLVED] IAR Workbench, cannot connect to J-Link

Status
Not open for further replies.

bkelly

Member level 1
Joined
Oct 2, 2011
Messages
38
Helped
2
Reputation
4
Reaction score
2
Trophy points
1,288
Location
USA
Activity points
1,639
Windows 7, IAR Workbench, Micrium eval board uC/Eval-STM32F107, project downloaded from Micrium web site and described in the Micrium book.

The project builds with no warnings or errors.
When the board is connected to the computer, the comptuer plays the standard double bonk tone to announce that a USB device has been connected. (It plays the same tones when a digital camera is connected).
Next I click the button "Download and Debug"
The error is:
Fatal error: Can not connect to J-Link via USB. Session aborted.

Does anyone have any suggestions as to what I might do different or where to look for a solution.

Thank you
 

Do you have a genuine J-link or a clone?

---------- Post added at 00:24 ---------- Previous post was at 00:22 ----------

I think you mean that J-link is on the board and not a separate device, right?
 

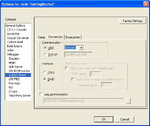
Have you ensure a valid J-Link device has been selected in the following dialog box:

Project -> Options -> J-Link/J-Trace

Tab: Communications

Drop Down Menu: Device

Select the connected J-Link.

BigDog

IAR-ARM-J-Link.jpg
 

alexan_e: Yes, the JTAG is on the board and should be accessible via the USB. According to the uC/OS-iii book
bigdogguru: I have selected Project -> Options -> Jlink/J-trace. The selection was set for USB Device 0. The options are Device 0 through 3 and I have tired each with the same result.
The Interface option is SWD but I don't know what that means. I selected SWD and was greeted with some new information about a loader and an update. The load failed, but there is a path and I am working that as I write this. I will get back to this thread after trying to chase down the new flash loader.

EDIT:
The load initially failed, then I tried again, and now it may be workings. The lights on the eval board stopped flashing and the debugger is sitting in AppTaskStart on line: int main(void)

So I am guessing that the switch to SWD triggered the download, after the download it failed startup once, then succeeded on the next try.

Working in windows and computers in general has shown that Einstein's definition of insanity is not valid.

Thanks for the suggestion.

Edit again:

Verify, yes, that has me working. I can tweak the code and see changes on the eval board.
Thank you.
 
Last edited:

Followup: I have the 32K quickstart version, the freebie. The Micrium book references C-Spy. The IAR site says very little about it and in the comments about the 32K version says some things are limits. It does not specifically mention C-Spy with referenct to the 32K version.

I cannot find the C-Spy icon or the utility in the View menu where the help file says it is. Is C-Spy excluded from this freebie version?
 

I believe C-Spy is just IAR's name for their debugger in the IAR Workbench.

Unfortunately, I do not have the Quickstart version available, I actually own licenses for several IAR Compilers.

Have you searched the the IAR Workbench Help System for "C-Spy"?


BigDog
 

Yes, I have searched. It says to find C-Spy in the View menu, its not there. In my Micrium book it says the icon is in the very upper left corner. Based on that and your response I presume that its not available in the freebie version and not worry about it any further. You don't get everything with a freebie. (but what I do have is pretty impressive.)
Thanks for your time.
 

bkelly said:
I cannot find the C-Spy icon or the utility in the View menu where the help file says it is.
bigdogguru said:
I believe C-Spy is just IAR's name for their debugger in the IAR Workbench.
As far as I remember the limited version offers everything except unlimited code size. I am using IAR EW 5.5 for AVR, I don't think that for other MCUs there will be such a great difference.
In the "View" menu and if you go to "toolbars", you can then select the "debug" option. That could perfectly be what the help file describes. The debug bar is what you are looking for I think.
 

As I mentioned in my previous post, C-Spy is the name of IAR Workbench Debugger.

Essentially, if you can set a breakpoint and control the flow of code execution using the J-Link, then you have the C-Spy features of the IAR workbench installed.

BigDog
 
  • Like
Reactions: alexxx

    alexxx

    Points: 2
    Helpful Answer Positive Rating
bigdogguru said:
As I mentioned in my previous post, C-Spy is the name of IAR Workbench Debugger.
Yes bigdogguru. That's what I wanted to point out by quoting your answer under bkelly's quote.
The rest of the answer was an explanation to bkelly's assumption about the demo version.
 

Under View -> Toolbars, Main and Debug were already checked. The debug tool bar contains buttons to start, stop, and various step options. But I cannot bring up the displays shown in the Micrium book.
I can those displays opened by starting the Micrium utility uC-Probe. But it does not communicate with the board or with IAR. I started another thread for that topic.
Even without that utility, I can develop and run my code.
Thanks for your help.
 

Status
Not open for further replies.

Part and Inventory Search

Welcome to EDABoard.com

Sponsor

Back
Top