Continue to Site

Welcome to EDAboard.com

Welcome to our site! EDAboard.com is an international Electronics Discussion Forum focused on EDA software, circuits, schematics, books, theory, papers, asic, pld, 8051, DSP, Network, RF, Analog Design, PCB, Service Manuals... and a whole lot more! To participate you need to register. Registration is free. Click here to register now.

How do I plot Phase Center vs. Frequency in CST Studio Suite?

Status
Not open for further replies.

mruzzi23

Newbie level 5
Joined
May 24, 2020
Messages
10
Helped
0
Reputation
0
Reaction score
2
Trophy points
3
Activity points
145
Hello, I'm writing a little report about an UWB antenna in the 3-6 GHz spectrum. The last point of the report says to calculate the Phase Center of the antenna and watch how it changes with the frequency. I tried to use the post-processing tools and I've been able to use "Export Phase Center" at the various frequencies, but I can't plot the variation with all the points, like this image
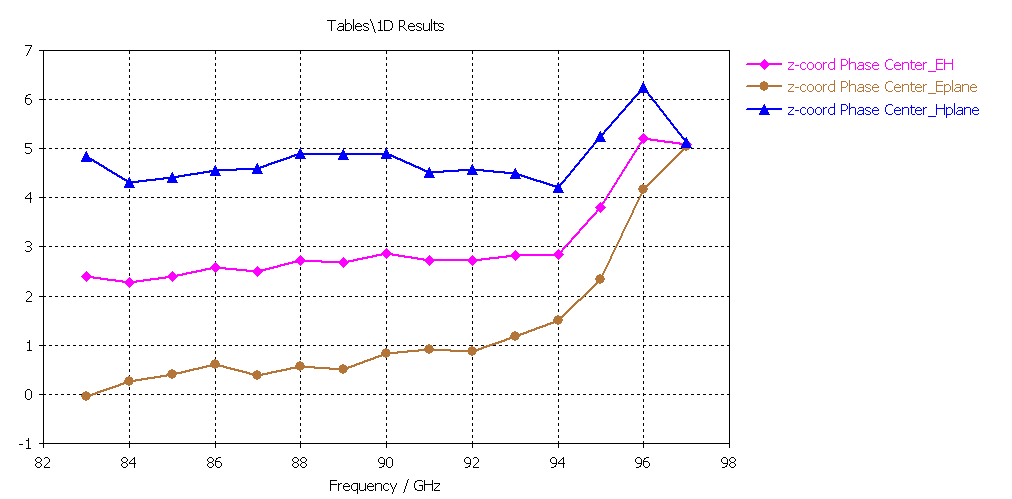
4844545600_1497600033.png

How can I do this?
Thank you
I have managed to do this.. do you still need to know?
 

Status
Not open for further replies.

Part and Inventory Search

Welcome to EDABoard.com

Sponsor

Back
Top