victorfan2010
Junior Member level 1
sorry maybe this question is stupid but please teach me~~~
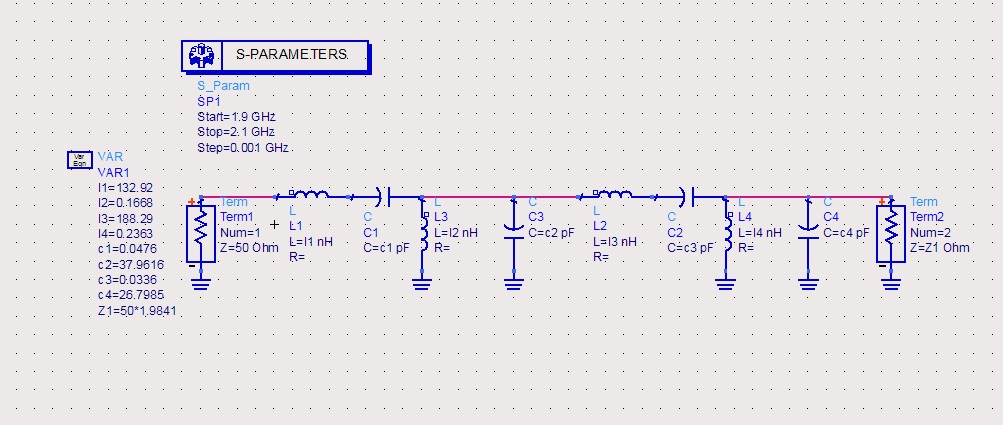
i studied microwave filter from textbook and now i designed a BPF by ADS shown below~~ the result is good and right~~but i want to use the matlab to simulate it~~~
my question is here the port 1 is 50 ohm, and the port 2 is NOT 50 ohm~~~
i can solve the circuit with both ports are 50 ohm however one port is not~~~
could you help me~~and i add the main program blow: thanks a lot~~
clear all
close all
clc
fc1=2e9;
ff=(1.9:0.001:2.1)*1e9;
g1=1.6703;
g2=1.1926;
g3=2.3661;
g4=0.8419;
g5=1.9841;
Z0=50;
thf=1e8;
w1=2*pi*fc1;
thw=2*pi*thf;
l1=g1*Z0/thw;
c1=1/(l1*w1^2);
c2=g2/Z0/thw;
l2=1/(c1*w1^2);
l3=g3*Z0/thw;
c3=1/(l3*w1^2);
c4=g4/Z0/thw;
l4=1/(c4*w1^2);
for ii=1:length(ff);
f=ff(ii);
w=2*pi*f;
A=[1,1i*w*l1;0,1];
B=[1,-1i/w/c1;0,1];
C=[1,0;-1i/w/l2,1];
D=[1,0;1i*w*c2,1];
E=[1,1i*w*l3;0,1];
F=[1,-1i/w/c3;0,1];
G=[1,0;-1i/w/l4,1];
H=[1,0;1i*w*c4,1];
total=A*B*C*D*E*F*G*H;
% Y1=abcd2y(total);
%
% s=y2s(Y1,Z0);
s=abcd2s(total,Z0);
s21(ii)=s(2,1);
end
figure(1)
S21dB=20*log10(abs(s21));
plot(ff,S21dB,'-r'), hold on
axis([min(ff) max(ff) -50 0])
xlabel('Frequency (GHz)')
ylabel('dB(S(2,1))')
grid on