Continue to Site

Welcome to EDAboard.com

Welcome to our site! EDAboard.com is an international Electronics Discussion Forum focused on EDA software, circuits, schematics, books, theory, papers, asic, pld, 8051, DSP, Network, RF, Analog Design, PCB, Service Manuals... and a whole lot more! To participate you need to register. Registration is free. Click here to register now.

High Signal to noise ratio in low frequency

Status
Not open for further replies.

Yada

Newbie
Joined
Aug 16, 2022
Messages
2
Helped
0
Reputation
0
Reaction score
0
Trophy points
1
Activity points
27
Dear all,

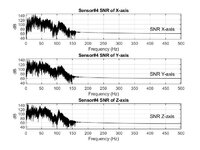
I wonder why the SNR is high in the lower frequency.
I have simulated the SNR from 4 Sensor's data set. I applied Low pass filter before calculating the SNR.
All the results show that SNR level is high in the lower frequency and at a certain frequency, the SNR becomes almost a constant value.
I think the reason is because of Low pass filter. However, I would like to know if there any other reason behind?

Can someone clear this up for me?

Thank you very much
 

Attachments

  • snr.jpg
    snr.jpg
    72 KB · Views: 168

Hi,

what measurement equippment did you use?
Show the measurement circuit.

Klaus
 

Hi,

what's the cutoff frequency of your LPF?
Is it an analog/physical filter or is it a digital one?
How have you calculated the SNR?
Are you analysing actual measurement data (simulated SNR)?

BR
 

Before we dive in let us understand what you think is wrong.
You got low pass filter. So any noise within passband is not going to be removed. That is what filtering means so why are you surprised that SNR seems high in passband relative to stopband?
 

Hi,

what's the cutoff frequency of your LPF?
Is it an analog/physical filter or is it a digital one?
How have you calculated the SNR?
Are you analysing actual measurement data (simulated SNR)?

BR
Hi
- the cut-off frequency is 1000 Hz
- it's a digital filter
- I have datasets of noise and signal from Sensor. So I basically applied to both of dataset and then just calculated snr=signal power/noise power then showing it over each frequency
- it is from the actual measurement
--- Updated ---

Hi,

what measurement equippment did you use?
Show the measurement circuit.

Klaus
Hello,

I actually only have the raw data from a measurement. So I must only do the signal analyse from those data I got
Before we dive in let us understand what you think is wrong.
You got low pass filter. So any noise within passband is not going to be removed. That is what filtering means so why are you surprised that SNR seems high in passband relative to stopband?
Hi,

I misunderstood the working principle of LPF. Thank you for guiding me.
 
Last edited:

Hi
- the cut-off frequency is 1000 Hz
- it's a digital filter
- I have datasets of noise and signal from Sensor. So I basically applied to both of dataset and then just calculated snr=signal power/noise power then showing it over each frequency
- it is from the actual measurement
--- Updated ---


Hello,

I actually only have the raw data from a measurement. So I must only do the signal analyse from those data I got

Hi,

I misunderstood the working principle of LPF. Thank you for guiding me.
From your plots the cutoff seems at 150 Hz yet you say it is 1000Hz. This may suggest wrong filter or wrong frequency plot scaling.
 

- it's a digital filter
  • which kind of filter?
  • Order?
  • Transitionband?
  • start of stopband?

For me it looks like you have messed up something with the rad/s to Hz conversion, as 1000 rad/s / (2 • pi) = 159.155 Hz. This frequency looks like the transition in your shown plots.

BR
 

Status
Not open for further replies.

Part and Inventory Search

Welcome to EDABoard.com

Sponsor

Back
Top